
The capacity to extract valuable insights from large datasets has become essential to succeed in the ever-changing business world. Microsoft’s Power BI is an excellent business intelligence platform at the top of this analytic revolution. It is not just any tool. It is a tool that helps businesses to transform raw data into valuable insights.
We’ll go through all of Power BI features, functions, and practical applications in this comprehensive tutorial, giving you the tools you need to become an expert in data analysis.
Table of Contents
- Top 20 Power BI Features
- 1. Modern Tooltip Now On By Default
- 2. Visual Calculations
- 3. On-Object Interactions
- 4. 100% Stacked Area Chart – New Visual
- 5. Dynamic Subscription for Power BI Experts
- 6. Extended Customization for Data Labels
- 7. Data Connectivity
- 8. Power BI Desktop
- 9. Power Query
- 10. Data Source (Get Data)
- 11. Analytics and Data Management
- 12. Artificial Intelligence
- 13. Large Datasets for Research
- 14. Intuitive Design
- 15. Robust Data Modeling
- 16. Azure Cognitive Services
- 17. Power Pivot
- 18. Stream Analytics
- 19. Matrix Layouts
- 20. Automatic Data Refreshers
- Conclusion
- FAQs
Top 20 Power BI Features
Microsoft once revealed that Power BI is used by 97% of the top Fortune 500 companies. This makes people wonder what features draw so many people to use this platform. Here is the list of the top 20 features; some are available for all, while others are available for the paid versions.
1. Modern Tooltip Now On By Default
Power BI tooltips are enhanced for functionality. Power BI has introduced the modern tooltip as a default, and it is more than just an upgrade. It will revolutionize tooltip customization and management and offer previously impossible possibilities.
2. Visual Calculations
Power BI users can only add or edit visual calculations on their service. Select new calculations from the context menu on a visual post, publishing the report to the service. You can access the visual calculations edit mode once the report is published with visual calculations. You must select the visual calculation and choose edit calculations.
3. On-Object Interactions
The build window was simplified, and the visual recommendations functionality was relocated to the on-object build button alone. Users can now use the on-object to suggest a visual. It also supports the gauge visuals now. You only need to double-click on the gauge visual and enter the format mode. Post that, right-click on the visual part you want to format with the mini-toolbar.
4. 100% Stacked Area Chart – New Visual
Power BI has introduced a new 100% stacked area chart in its core visual gallery. The relative percentages of several data series are shown in stacked sections in these graphics, with 100% as the overall total. It’s ideal for illustrating how different series compare to the total and how they evolve. You can locate it next to the Stacked Area Chart in the Format pane, on-object dialog, or visual gallery.
5. Dynamic Subscription for Power BI Experts
The platform has introduced dynamic subscriptions for Power BI reports in preview. It helps distribute personalized copies of any Power BI report to every recipient of the mail subscription. Connecting to a semantic model (formerly a Power BI dataset) that specifies the mapping between receivers and corresponding filter values is now possible to do with this.
When it comes time to distribute the report, the most recent information in your semantic model will decide which employees should get it via email and under what filter settings.
6. Extended Customization for Data Labels
Data labels now have several improved features that offer more customization options. This has a few additional X-axis information. Before, the only thing that could be shown was the label of the utilized measure. Grouped bar charts can now be substituted by just showing the measure.
For example, values 2022 and 2023 are displayed as two bars instead. Value 2023 may now be shown as a bar with the growth labeled. Lastly, the data that we typically display in a tooltip when a user hovers over a chart is now displayed more effectively, thanks to this new improvement. These new Data Label features significantly improve the data density in charts.
7. Data Connectivity
Users of Power BI desktop have access to several data sources, including databases, such as SQL, Oracle, etc., and cloud services, such as Azure, Google Analytics, Salesforce, Excel, and many more. This allows you to collect all your data in one place for thorough analysis.
Connecting to data is the initial stage. Connect to a wide range of data sources with Power BI Desktop. Select Get Data > More from the Home ribbon. When the Get Data window opens, it displays all of the categories that Power BI Desktop is compatible with. You can alter the data once you’ve connected to one or more data sources to utilize it.
8. Power BI Desktop
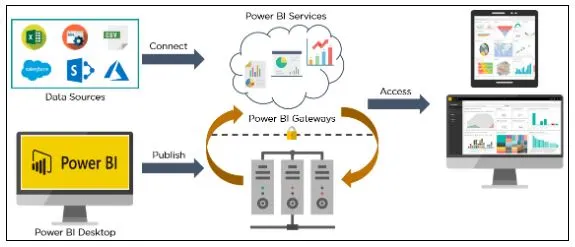
With Power BI Desktop, you can simply create reports by accessing data through a free download and installation. You don’t need sophisticated report design or query-building abilities to use a Power BI desktop.
9. Power Query
Integrated with Power BI, Power Query is a potent data transformation and ETL (Extract, Transform, Load) tool. It is appropriate for data preparation jobs since it offers an easy-to-use interface for shaping and cleaning data from various sources.
10. Data Source (Get Data)
Power BI users can choose from various data sources using the Get Data tool. The sources of the data range from unstructured to structured, on-site to cloud-based. Every month, new data sources are added. Here are a few of the most recent data sources that are accessible:
| Excel | Power BI datasets | Power BI dataflows | SQL Server |
| MySQL database | Analysis services | Azure | CSV/Text |
| Oracle | Access | XML/JSON |
11. Analytics and Data Management
Microsoft Power BI provides powerful analytics to help customers obtain insightful knowledge and turn data into components that may spark innovative ideas and breakthroughs to solve business challenges. Business users with Power BI may monitor important performance metrics thanks to advanced analytics.
It assists the company in identifying the indicators that point to future growth and success. Power BI is a sophisticated data management tool that deserves to be called that produces beautiful interactive dashboards. It finds data patterns using BI and data mining technologies and offers tools to support advanced analytics.
12. Artificial Intelligence
With Power BI, users can access AI-powered text analytics and image recognition. They can also interface with Azure Machine Learning and develop machine learning models with automated features. Users may ask questions and get answers regarding data using Power BI’s Q&A feature, which uses natural language processing, an AI subfield related to chatbots.
Additionally, Copilot, Microsoft’s AI-powered chatbot, is being integrated into Power BI to enable users to ask questions about data and create bespoke reports.
13. Large Datasets for Research
A dataset is a single set of data assembled from several sources. Analyzing datasets in Microsoft Excel can become complicated and time-consuming as you would need to examine data from more than a million rows.
Power BI’s Datasets function lets you compress data and analyze datasets with tens of millions of rows, which is perfect for extracting insights from big datasets.
Nobody wants to dedicate their entire day to searching the internet for a particular piece of information. Users may import data and establish connections to many data sources using Power BI. They can then narrow the datasets into more manageable selections that only include the most critical data. By purchasing the BI Premium, organizations may have access to more comprehensive storage and processing capabilities.
14. Intuitive Design
The platform is designed to keep the work done by data analysts in mind. Therefore, the interface is very user-friendly and intuitive. Its layout is very organized and clean, which makes it easier to find and access different tools and features. Some of its key aspects are ribbon interface, contextual manual, and customizable dashboards.
15. Robust Data Modeling
With Power BI’s extensive data modeling tools, you can design calculated measures and columns, execute intricate calculations, and establish links across various data tables. Its excellent data analysis expressions enable the users to express business logic and do calculations beyond simple aggregation. This modeling can also help unlock the data and take valuable insights.
16. Azure Cognitive Services
These pre-trained ML models help obtain valuable insights from large datasets. Their features are immediately included in Power BI to offer efficient methods for extracting data from various sources, including documents, social media feeds, and photos. The integrated algorithms may find the names of companies, individuals, and places in documents, which can subsequently be utilized as insights to help users make more educated decisions.
17. Power Pivot
This excellent Power BI feature helps organize and model different data pieces. Users can use an expression language to create models and relationships for simple or complex datasets.
18. Stream Analytics
Stream analytics is one of the best features of Power BI and also one of its advantages. It supports real-time analytics for fast decisions across different sources, irrespective of industry and department.
19. Matrix Layouts
Through matrix layouts, users can select from outlines, compact, or tabular layouts to change the arrangements of the components, like Excel. Report creators can now create unique layout patterns by repeating row headings, adding to the new layout possibilities. This robust control allows for the development of a matrix that closely mimics the appearance and feel of a table. Excel’s PivotTable style inspired it.
This improvement offers more versatility and gives Power BI’s matrix visualizations a hint of Excel’s user-friendly style. It is available only in Tabular and Outline formats. Report creators can now add blank rows to the matrix, better aligning with Excel’s capability.
This feature improves the report’s readability, which makes it possible to separate higher-level row header groups. Power BI’s matrix visualizations now have an additional layer of structure and clarity thanks to this well-considered innovation, which also paves the way for future improvements to the totals, subtotals, and rows/column headings.
20. Automatic Data Refreshers
By automating and renewing your datasets, Power BI’s scheduled refresh function relieves you of the laborious, manual report updates. Your team may effortlessly uncover and share insights by promptly and adequately updating your data.
Conclusion
In conclusion, the top 20 Power BI features for 2025 demonstrate the platform’s developing capabilities and enable users to more efficiently and effectively convert data into meaningful insights. These enhancements accommodate novice and expert users, offering improved data visualization tools to sophisticated analytics and AI-driven features.
By keeping up with these features, you can fully utilize Power BI, improving decision-making and encouraging a data-driven culture inside your company. Gaining proficiency with these tools will help you stay ahead of the constantly evolving data analytics scene as Power BI innovates.
If you want to learn and explore Power BI, you can enroll in the data analytics and engineering bootcamp offered by CCSLA. In a short 12-weeks time, you can become an expert in this field and join your dream job.