There are no two opinions about the fact that Power BI is a powerhouse in the world of data visualization, but is it the only option? However, finding the right analytics platform that focuses on flexibility, pricing, or even complex features can improve the process for your business, and thankfully there are plenty of Power BI Alternatives available.
In today’s fast-paced world, data-driven decision-making has become a game-changer for businesses. The right tools and apps aren’t just helpful—they’re essential. From cloud-based platforms to AI-powered analytics, the data visualization landscape is evolving at lightning speed. Staying ahead of the curve isn’t just an option; it’s a necessity. After all, the data doesn’t lie.
Power BI alternatives for 2025, breaking down their key features, strengths, and ideal use cases to help you find the best match for your needs. Let’s dive in!
Why Consider a Power BI Alternative?
Power BI is a robust tool, but it has its limitations:
- Microsoft-Centric Ecosystem: Power BI is designed to work best within the Microsoft ecosystem which may pose limitations for non-Windows users or those with diverse platforms.
- Steep Learning Curve: Mastering DAX (Data Analysis Expressions) and advanced features can be complex and time-consuming, requiring significant practice and expertise.
- Lack of customization: Users often struggle with flexibility in visualization tools, finding it challenging to fully explore and tailor data visualizations to their needs.
- Pricing Complexity: Although inexpensive for small businesses, premium features can turn out expensive for larger enterprises.
If these limitations resonate with your challenges, you can explore some of its alternatives. To make your task easy, below are some of the top alternatives that can help you achieve your goals.
Read more: Power BI Pro vs. Premium: Ultimate Comparison Guide
Top 15 Power BI Alternatives for 2025
1. Tableau
With its drag-and-drop interface and ability to create beautiful, interactive dashboards, the tableau is a leader among data visualization tools. It facilitates real-time data integration, complex analytics capabilities, and integration with multiple data sources. Due to its high scalability, tableau is preferred by big enterprises and data analysts. With this you can easily create dashboards and reports with the help of data that is stored in Excel, SQL Server, or Azure.
Features
- Drag-and-drop interface.
- Real-time data integration.
- Advanced analytics and forecasting.
- Extensive visualization options.
- Strong community support.
Comparison: Power BI vs Tableau
| Feature | Power BI | Tableau |
|---|---|---|
| Ease of Use | User-friendly with Microsoft ecosystem integration. | Drag-and-drop interface requires some learning. |
| Data Integration | Works well with Microsoft products like Excel, SQL Server, and Azure. | Supports multiple data sources, strong real-time integration. |
| Analytics Capabilities | Advanced AI and ML capabilities with Power Automate. | Advanced analytics, forecasting, and visual storytelling. |
| Customization | Good customization but limited compared to Tableau. | Extensive customization with various visualization options. |
| Community Support | Strong Microsoft community. | Large and active user community. |
| Pricing | Starts at $10/user/month. | Starts at $15/user/month. |
| Best For | Small to large enterprises, Microsoft users. | Data analysts, large enterprises needing interactive dashboards. |
👉 Verdict: If you’re in the Microsoft ecosystem, Power BI is a cost-effective choice. If you need advanced visuals and complex data handling, you can go for Tableau.
2. Qlik Sense
Qlik Sense has its unique execution data model that lets users slice and dice through various data points without any static data queries. It provides real-time updates, AI-based insights, and an easy-to-use interface. Qlik Sense is a perfect choice for companies looking for interactive dashboards or self-service analytics. It allows you to develop dashboards and visualizations based on your organizational needs.
Features:
- Associative data model.
- AI-driven insights.
- Real-time data updates.
- Self-service analytics.
- Mobile-friendly interface.
Comparison: Power BI vs Qlik Sense
| Feature | Power BI | Qlik Sense |
|---|---|---|
| Ease of Use | Beginner-friendly. | Slight learning curve. |
| AI & Automation | Limited AI features. | AI-driven insights with automation. |
| Data Handling | Works well with structured data. | Associative model, better for big data. |
| Real-Time Data | Limited support. | Strong real-time data updates. |
| Pricing | Starts at $10/user/month. | Starts at $825/user/month. |
| Best For | SMBs, Microsoft users. | Enterprises need dynamic analytics. |
👉 Verdict: Power BI is more affordable and integrates well with Microsoft tools, while Qlik Sense is best for big data & real-time analytics.
Read more: Top 20 Power BI Features You Must Know.
3. Looker (Google Cloud)
Looker is another powerful BI tool that is now a part of Google Cloud. It uses SQL-based data modeling to customize appropriate reports and clean dashboards. Not only with Google Cloud, but it also integrates with other data sources. Its collaboration and data analytics features make this tool highly selected by the users. Say, if your organization wants to invest in the Google ecosystem, then you can surely go with this tool. Overall, it can be considered as a good alternative to a power BI if you need features like data analytics and modeling.
Features:
- SQL-based data modeling.
- Real-time analytics.
- Google Cloud integration.
- Customizable dashboards.
- Collaboration tools.
Comparison: Power BI vs Looker
| Feature | Power BI | Looker (Google Cloud) |
|---|---|---|
| Data Modeling | Simple but effective. | SQL-based data modeling. |
| Integration | Microsoft-centric. | Google Cloud integration. |
| Visualization | Strong dashboarding. | Customizable dashboards. |
| Collaboration | Limited collaboration. | Advanced collaboration tools. |
| Pricing | Starts at $10/user/month. | Custom pricing. |
| Best For | Microsoft users, small businesses. | Google ecosystem users, data analysts. |
👉 Verdict: Power BI is better for Microsoft users, while Looker is perfect for those working with Google Cloud & SQL-based analytics.
4. Sigma Computing
Sigma is another one of the best power bi alternatives which combines the familiarity of spreadsheets with the power of cloud-native analytics. Not only its User-friendly interface, but also its seamless integration with cloud data warehouses makes this highly recommended. Moreover, if your team requires intuitive, Excel-like data exploration then you can go ahead with this alternative.
Features:
- Spreadsheet-like interface.
- Real-time collaboration.
- Cloud-native analytics.
- Easy-to-use interface.
- Highly Scalable tool.
Comparison: Power BI vs Sigma Computing
| Feature | Power BI | Sigma Computing |
|---|---|---|
| User Interface | Dashboard-based. | Spreadsheet-like, Excel-like UI. |
| Collaboration | Limited collaboration. | Real-time collaboration. |
| Cloud-Native | Cloud & on-premises options. | Fully cloud-native. |
| Pricing | Starts at $10/user/month. | Starts at $25,000 annually. |
| Best For | Businesses need dashboards. | Teams familiar with spreadsheets. |
👉 Verdict: Sigma Computing is best if your team is used to Excel, while Power BI offers better affordability.
5. Domo
Domo is another cloud-based BI platform that can be added to your bucket list. It offers real-time data visualization, AI-driven insights, and mobile-friendly dashboards. You can easily integrate Demo with different sources and can make the best use of this centralized platform for data-driven decision-making. So, if you are an enterprise and require mobile access and a real-time dashboard then Demo can be your go-to option.
Features:
- Real-time data visualization
- AI-driven insights
- Mobile-friendly
- Centralized data platform
- Extensive integrations
Comparison: Power BI vs Domo
| Feature | Power BI | Domo |
|---|---|---|
| Data Visualization | Standard BI visuals. | Real-time visual analytics. |
| AI & Automation | Limited AI integration. | AI-driven insights. |
| Mobile-Friendly | Basic mobile compatibility. | Strong mobile-first dashboards. |
| Pricing | Starts at $10/user/month. | Custom pricing. |
| Best For | Small to medium businesses. | Enterprises need mobile analytics. |
👉 Verdict: If you need real-time insights & mobile dashboards, go for Domo. Power BI is more affordable and integrates well with Microsoft.
Read more: Top 30 Power BI Interview Questions with Best Answers.
6. Sisense
Another robust BI tool, which is well known for its ability to handle large data sets and embedded analytics, is no other than Sisense. Its customized dashboards, seamless integration, and AI-driven insights capture the attention of users. This is mostly preferred by large enterprises that keep a high check in managing complex data environments.
Features:
- Embedded analytics.
- Customizable dashboards.
- AI-driven insights.
- Big data handling.
- Scalable tool.
Comparison: Power BI vs Sisense
| Feature | Power BI | Sisense |
|---|---|---|
| Data Handling | Best for structured data. | Handles big data & embedded analytics. |
| Customization | Limited customization. | Highly customizable. |
| AI & ML | Basic AI integration. | AI-driven insights. |
| Pricing | Starts at $10/user/month. | Custom pricing. |
| Best For | Small businesses, Microsoft users. | Enterprises need embedded analytics. |
👉 Verdict: Sisense is great for big data and custom embedded analytics, while Power BI is more user-friendly.
7. Zoho Analytics
Zoho Analytics is another affordable BI tool that offers seamless integration with Zoho apps and other data sources. Its drag-and-drop interface and AI-powered insights can make you feel added to your bucket list. No matter whether you own a small business or a medium-sized business, you can invest in this Zoho ecosystem.
Features:
- AI-powered insights.
- Drag-and-drop interface.
- Affordable pricing.
- Zoho app integration.
- Customizable dashboards.
Comparison: Power BI vs Zoho Analytics:
| Feature | Power BI | Zoho Analytics |
|---|---|---|
| Ease of Use | Beginner-friendly. | Easy drag-and-drop. |
| AI & Automation | Limited AI features. | AI-powered insights. |
| Integration | Best for Microsoft tools. | Best for Zoho ecosystem. |
| Pricing | Starts at $10/user/month. | Starts at $24/month. |
| Best For | SMBs, Microsoft users. | SMBs, Zoho users. |
👉 Verdict: If you’re in the Zoho ecosystem, go for Zoho Analytics. Otherwise, Power BI offers better integration & affordability.
8. Metabase
Are you looking for an open-source BI tool that is both user-friendly and offers SQL-based querying? If yes, then Metabase can be your choice. This cost-effective solution captures the attention of all the users, especially the users and the teams that require self-hosted analytics. Therefore, if you are running a simple and no-frills BI tool that can help you achieve your goals without breaking the bank then you can surely go with Metabase.
Features:
- Open-source tool.
- SQL-based querying.
- User-friendly interface.
- Self-hosted platform.
- Affordable tool.
Comparison: Power BI vs Metabase
| Feature | Power BI | Metabase |
|---|---|---|
| Ease of Use | User-friendly with drag-and-drop interface. | Extremely intuitive, designed for beginners. |
| Visualization | Extensive library of customizable visuals. | Focus on basic charts and dashboards. |
| Data Connectivity | Connects to various data sources. | Connects to various data sources. |
| Customization | Connects to various data sources. | Connects to various data sources. |
| Customization | High degree of customization. | Limited customization options. |
| Pricing | Starts at $10/user/month. | Free for open-source; paid plans for advanced features. |
| Best For | Businesses need comprehensive BI solutions. | Small teams and startups for quick insights. |
👉 Verdict: Power BI offers a more comprehensive and customizable BI solution suitable for businesses of all sizes. Metabase provides a cost-effective, user-friendly option for small teams and startups seeking quick insights without extensive customization.
Read more: Top 10 Power BI Limitations: Must Know List
9. Holistics
Holistic is a code-based and scalable BI tool that can be another choice. Its Git version control and SQL-based data modeling features add this tool to the top 15 list of Power BI alternatives. Moreover, it offers reusable BI components that are most preferred for teams or organizations who want to prioritize code-based analytics as well as version control.
Features:
- SQL-based data modeling.
- Git version control.
- Reusable BI components.
- Code-based analytics.
- Scalable platform.
Comparison: Power BI vs Holistics
| Feature | Power BI | Holistics |
|---|---|---|
| Ease of Use | User-friendly with drag-and-drop interface. | Requires SQL knowledge. |
| Visualization | Extensive library of customizable visuals. | Focus on data modeling and reporting. |
| Data Connectivity | Connects to various data sources. | Primarily for SQL databases. |
| Customization | High degree of customization. | High degree of customization. |
| Pricing | Starts at $10/user/month. | Pricing varies; generally higher. |
| Best For | Businesses need comprehensive BI solutions. | Data teams requiring advanced data modeling. |
👉 Verdict: Power BI is suitable for users seeking a user-friendly interface with extensive data connectivity. Holistics is ideal for data teams requiring advanced data modeling and reporting capabilities within SQL environments.
10. ThoughtSpot
ThoughtSpot uses natural language search and AI-driven insights to make data exploration intuitive for non-technical users. It offers real-time analytics and seamless integration with various data sources. ThoughtSpot is perfect for businesses seeking easy-to-use analytics.
Features:
- Natural language search.
- AI-driven insights.
- Real-time analytics.
- Easy-to-use Platform.
- Scalable tool.
Comparison: Power BI vs ThoughtSpot
| Feature | Power BI | ThoughtSpot |
|---|---|---|
| Search & AI | Limited search capabilities. | AI-powered natural language search. |
| Ease of Use | Beginner-friendly dashboards. | Intuitive search-based insights. |
| Real-Time Data | Limited Analytics. | Strong real-time analytics. |
| Pricing | Starts at $10/user/month. | Custom pricing. |
| Best For | Business users, SMBs. | Non-technical users needing AI insights. |
👉 Verdict: If you need AI-powered search analytics, go for ThoughtSpot. If you’re looking for standard BI dashboards, stick with Power BI.
11. MicroStrategy
Another enterprise-grade BI tool that you can use to get ahead with MicroStrategy. It offers various excellent features like advanced analytics, predictive modeling, and mobile compatibility that make it effective to use. If you are searching for a tool that can suit large organizations that offers scalable, robust solutions for complex data environments, then you can proceed with this tool.
Features:
- Advanced analytics.
- Predictive modeling.
- Mobile compatibility.
- Scalable tool.
- Enterprise-grade.
Comparison: Power BI vs MicroStrategy
| Feature | Power BI | MicroStrategy |
|---|---|---|
| Ease of Use | User-friendly with drag-and-drop interface. | Steeper learning curve. |
| Visualization | Wide range of customizable visuals. | Advanced, interactive dashboards. |
| Data Connectivity | Extensive connectors, including SAP HANA and BW. | Over 200 connectors, including cloud services. |
| Advanced Analytics | AI capabilities like Quick Insights. | Advanced analytics and reporting. |
| Pricing | Starts at $10/user/month. | Pricing varies; generally higher. |
| Best For | Small to medium-sized businesses. | Large enterprises requiring robust BI solutions. |
👉 Verdict: Power BI offers a more accessible and cost-effective solution for small to medium-sized businesses. MicroStrategy offers a comprehensive BI platform suitable for large enterprises with complex analytics needs.
Read more: Power BI Import vs. Direct Query: Which ModeYou Should Use?
12. Plotly
Another alternative to Power BI is Plotly. This open-source tool not only supports Python/R but also offers custom visualizations and interactive graphics. This is mostly recommended for developers and technical users. Thinking why? Well! It offers advanced, code-based data visualization features that make it highly useful.
Features:
- Open-source platform.
- Python/R support.
- Interactive graphs.
- Custom visualizations.
- Developer-friendly.
Comparison: Power BI vs Plotly
| Feature | Power BI | Plotly |
|---|---|---|
| Ease of Use | User-friendly with drag-and-drop interface. | Requires coding knowledge (Python/R). |
| Visualization | Extensive library of customizable visuals. | Advanced, interactive graphs and charts. |
| Data Connectivity | Connects to various data sources. | Primarily for data in Python/R environments. |
| Customization | High degree of customization. | High degree of customization. |
| Pricing | Starts at $10/user/month. | Free for basic; paid plans for advanced features. |
| Betst For | Businesses need comprehensive BI solutions. | Data scientists and developers for custom visualizations. |
👉 Verdict: Power BI is suitable for users seeking a user-friendly interface with extensive data connectivity. Plotly is ideal for developers and data scientists requiring advanced, customizable visualizations within coding environments.
13. Infogram
Infogram is also a user-friendly alliterative to power BI tools for data visualizations. Its easy-to-use templates and features to create infographics make it interesting to use. So, if you are from a marketing team or a beginner who wants to create quick and visually appealing reports then you choose Infogram over others.
Features:
- Easy-to-use templates.
- Infographic creation.
- Team collaboration.
- Visually appealing reports.
- Affordable tool.
Comparison: Power BI vs Infogram
| Feature | Power BI | Infogram |
|---|---|---|
| Ease of Use | User-friendly with drag-and-drop interface. | Extremely intuitive, designed for beginners. |
| Visualization | Advanced, interactive dashboards. | Focus on infographics and simple charts. |
| Data Connectivity | Connects to various data sources. | Limited to data imports. |
| Customization | High degree of customization. | Limited customization options. |
| Pricing | Starts at $10/user/month. | Starts at $25/user/month. |
| Best For | Businesses need complex data analysis. | Marketing teams and quick visualizations. |
👉 Verdict: Power BI is ideal for comprehensive data analysis and interactive dashboards. Infogram is better suited for creating quick, visually appealing infographics with minimal data complexity.
14. Google Data Studio
Are you looking for a free Power BI tool? You can go with Google Data Studio. It offers real-time collaboration and seamless integration with Google products. If you have already invested in the Google ecosystem and running or working in a small business, then you can choose Google Data Studio.
Features:
- Free
- Real-time collaboration
- Google integration
- Easy-to-use
- Customizable dashboards
Comparison: Power BI vs Google Data Studio
| Feature | Power BI | Google Data Studio |
|---|---|---|
| Cost | Paid plans start at $10/month | Free |
| Integration | Microsoft apps | Google products (Sheets, BigQuery) |
| Ease of Use | Beginner-friendly | Easy to use, but limited features |
| Best For | Business users | Small businesses & Google users |
👉 Verdict: If you’re on a budget and work with Google tools, Google Data Studio is a great option. For enterprise-level analytics, Power BI is more robust.
15. SAP Analytics Cloud
Last but not least is SAP Analytics Cloud. It is a cloud-based BI tool that combines predictive analytics, machine learning, and real-time insights. Its integration with SAP systems makes this tool apart from others. It’s tailored for enterprises with complex planning and forecasting needs. So, are you ready for a seamless experience? Choose SAP Analytics Cloud.
Features:
- Predictive analytics
- Machine learning
- Real-time insights
- Scalable
- Enterprise-grade
Comparison: Power BI vs SAP Analytics Cloud
| Feature | Power BI | SAP Analytics Cloud |
|---|---|---|
| Integration | Seamless with Microsoft products | Seamless with SAP products |
| Data Connectivity | Extensive connectors, including SAP HANA and BW | Primarily designed for SAP data sources |
| Advanced Analytics | AI capabilities like Quick Insights | Predictive analytics and planning |
| Visualization | Wide range of customizable visuals | Industry-specific templates |
| Pricing | Starts at $10/user/month | Starts at $22/user/month |
| Best For | Microsoft-centric organizations | SAP-centric organizations |
👉 Verdict: Choose Power BI for broader integration and affordability, especially if you’re within the Microsoft ecosystem. Opt for SAP Analytics Cloud if you’re deeply invested in SAP systems and require advanced planning and predictive analytics.
Read more: Power BI Dashboard vs Report: Key Differences Explained.
How to Choose the Right BI Tool for Your Business?
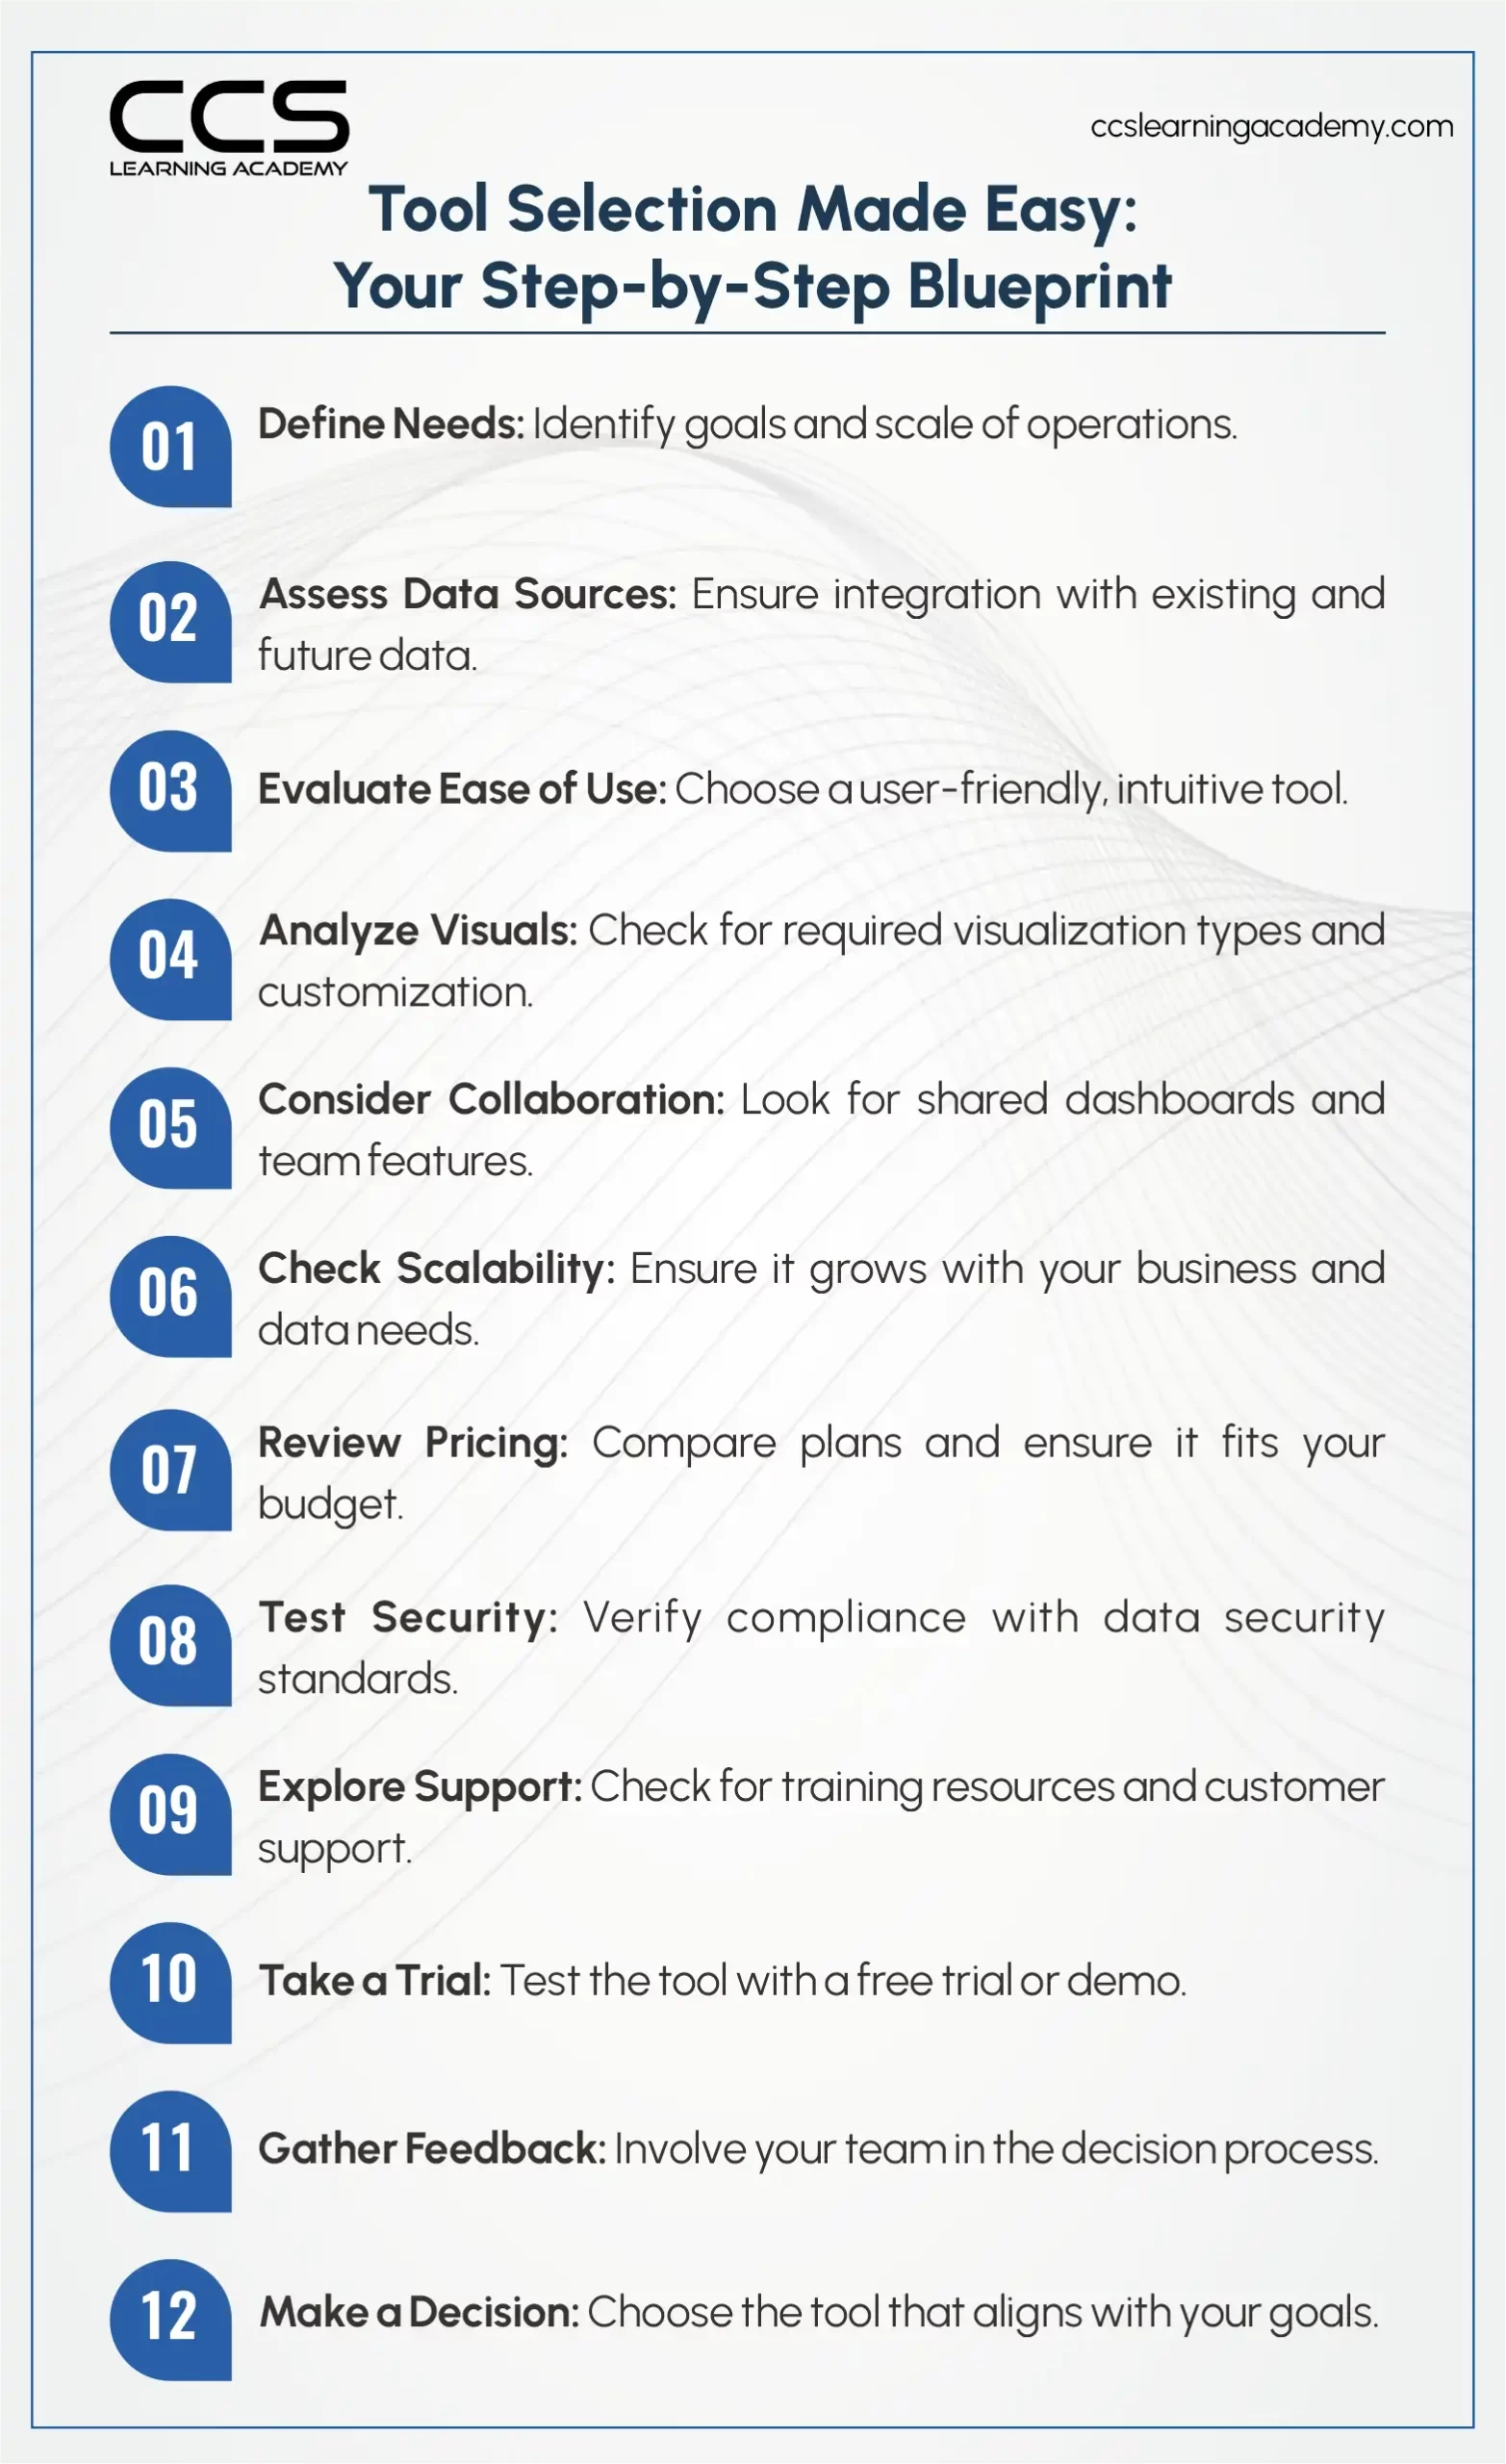
Now that you have the list of the best Power BI alternatives. It’s time to understand how to make an informed decision and choose the best tool for yourself and your team. So, whenever you plan to choose the right tool for your business, make sure to consider these factors-
- Ease of Use: Make sure the tool you choose is accessible to both technical and non-technical users.
- Integration Capabilities: Check if the tool can easily be integrated with your existing data sources and platforms.
- Scalability: Go with the tool that helps you grow with your business.
- Cost: This is one of the most essential factors that help you in deciding on the tool. Make sure that the tool you choose aligns with your budget.
- Customization: Prefer choosing the tool that offers flexibility in dashboard design and data exploration.
Conclusion
Well! The right BI tool can transform how your organization leverages data. While Power BI is a strong contender, alternatives like Tableau, Qlik Sense, and Looker offer unique features that may better suit your needs. Whether you’re a small business or a large enterprise, there’s a tool on this list that can help you unlock the full potential of your data.
Looking to enhance your data analytics skills and stay ahead in the industry? Our Data Analytics & Engineering Bootcamp provides hands-on training to help you master data visualization, analytics tools, and real-world insights to drive business success.