
Discover the top 7 Business Intelligence tools to master in 2025. Stay ahead with powerful BI solutions for data analysis, visualization, and decision-making.
Business intelligence (BI) plays a crucial role for organizations across industries to make informed decisions based on data-driven insights. As data volumes and complexities continue to grow exponentially, the ability to extract value from massive amounts of internal and external data has become imperative for businesses. This has led to a steep rise in the adoption of business intelligence tools that help organizations consolidate large pools of data, perform advanced analytics, and generate actionable reports and visualizations.
While there are hundreds of BI tools available in the market today, learning the right tools can help you build a career in this highly in-demand field. In this article, we will discuss the top 7 business intelligence tools that are widely used by organizations and will continue to be relevant in 2025 and beyond. Mastering these tools will help you gain core BI skills valued by employers.
What is Business Intelligence?
Business intelligence refers to technologies, applications and practices for the collection, integration, analysis, and presentation of business information. The purpose of business intelligence is to help organizations use data to make better decisions and take strategic actions in areas such as customer relationship management, data organization, and more.
At its core, business intelligence involves converting large amounts of data from various internal and external sources into meaningful and useful information for decision-makers. Some key internal sources that provide data include customer relationship management systems, enterprise resource planning systems, and other operational databases. External sources may include documents, images, emails, videos, journals, books, social media posts, files, and more.
Read more: Want to Become a Business Intelligence Analyst? Here’s How to Do It!
How BI Tools Help Transform Data into Actionable Insights?
BI tools help organizations extract structured and unstructured data from these various sources through queries. The data is then processed and analyzed to identify patterns, trends and insights that can benefit strategic planning and operations. The final results are typically presented through interactive dashboards, reports, charts and graphs in a visually appealing format that is easy for users to understand.
There are four main capabilities that enable BI tools to transform raw data into actionable insights. Firstly, tools integrate data from multiple sources such as databases, spreadsheets and cloud applications into a single location.
Then, data transformation functions clean, structure and aggregate the data since it often comes in many different formats. Visualization is another key aspect, as tools represent large datasets visually through reports and dashboards to highlight trends and patterns. Finally, automated reporting delivers customized reports and visualizations to stakeholders on a scheduled basis.
By utilizing BI tools, businesses gain several important benefits. Tools provide a single source of truth for consolidated organizational data, enabling accurate trend analysis and data-driven decision-making.
They also improve efficiency by automating repetitive manual data-handling tasks. With insights into trends, issues can be identified and addressed proactively. Overall, BI tools empower organizations to optimize processes, identify growth opportunities, and make strategic decisions supported by data-backed analysis rather than guesses or instincts alone.
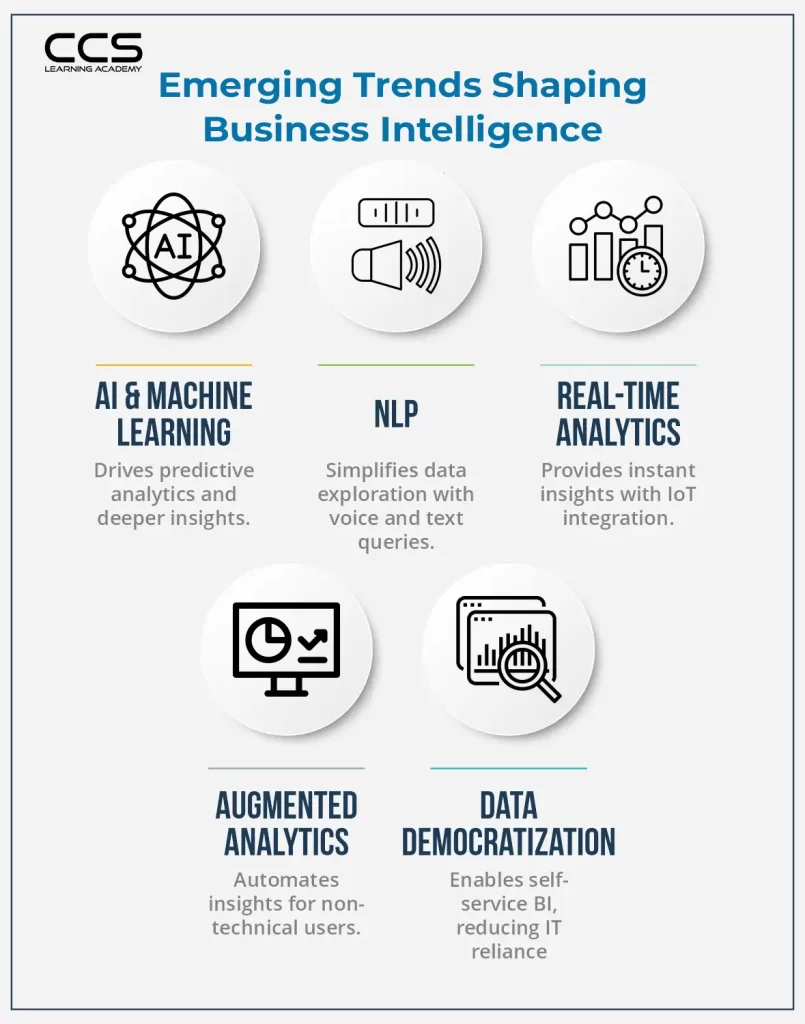
Read more: Top 10 Business Intelligence & Analytics Trends.
The Growing Demand for BI Professionals
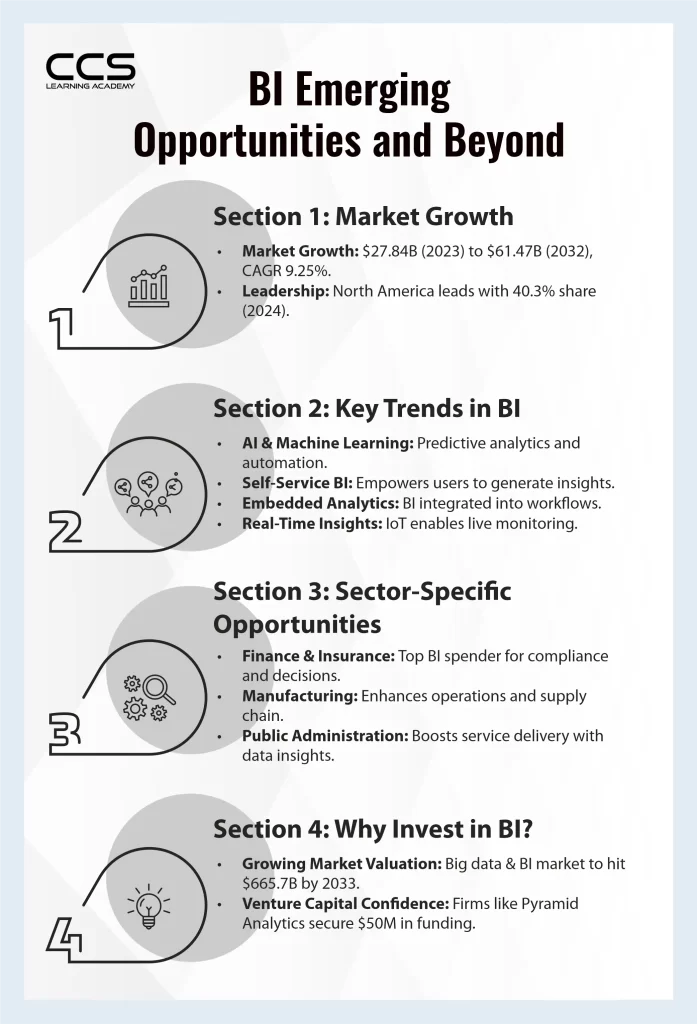
As the amount of digital data generated worldwide continues to grow exponentially, the demand is also surging for professionals who have the skills to extract value from this data through business intelligence. The Business Intelligence (BI) market is projected to grow from USD 23.1 billion in 2020 to USD 33.3 billion by 2025, with a Compound Annual Growth Rate (CAGR) of 7.6%. The diverse capabilities of BI tools are driving this growth, positioning the market to reach a value of $33.3 billion by 2025.
Specifically, roles like data analyst, data scientist, BI developer and BI manager are in high demand across every industry as companies leverage information to their advantage. Professionals skilled in data collection, analysis, visualization and strategy are needed to help translate raw numbers into actionable plans.
As data becomes more integral to decision-making, the demand is expected to remain strong for candidates proficient in technologies like Tableau, Microsoft Power BI, Qlik and SAS. Staying up to date on emerging BI tools through continued learning is important for career growth.
Top Business Intelligence Tools
The following are the Top Business Intelligence Tools:
1. Microsoft Power BI
Microsoft Power BI is arguably one of the most popular BI tools used across various sectors. As a Microsoft product, it offers seamless integration with the company’s existing applications and services like Excel, Azure, and Office 365. Power BI allows users to connect myriad internal and external data sources like databases, cloud services, and live data streams.
After the data is imported, users can perform transformative operations like joining, filtering, modeling, etc. Power BI supports various data modeling and visualization techniques to generate interactive charts, dashboards, and reports. Its AI capabilities help users discover patterns using natural language queries. Dashboards can be shared across desktop, web, and mobile for collaboration.
Power BI offers three pricing tiers – Free, Pro, and Premium. The free version is sufficient for basic use cases, while the Pro and Premium tiers provide additional advanced features for enterprise-grade requirements. Power BI strengthens as a comprehensive BI solution due to Microsoft’s vast resources for continuous improvements and innovations. Its intuitive interface makes it one of the easiest tools to learn for beginners.
2. Tableau
Tableau is another prominent player in the BI market delivering powerful visualization capabilities. Like Power BI, Tableau allows connecting multiple databases, files, and cloud applications. However, its strength lies in transforming raw data into interactive dashboards and stories through drag-and-drop workflows.
Tableau supports over 60 different chart types along with dynamic calculations to gain insights from various perspectives. The dashboards can be enhanced with interactive features, multimedia, maps, and more. For collaboration, desktop and online versions offer real-time dashboard publishing along with user access management.
Tableau offers flexible subscription licensing with Online, Desktop, and Server versions. It also provides Tableau Public for free sharing of views and dashboards. Large Enterprises prefer Tableau for its performance with huge datasets, governance controls, and integrations. Tableau skills are highly sought-after since they deliver storytelling capabilities beyond traditional reporting.
3. Qlik
Qlik is another top-rated BI vendor suitable for both small/medium businesses and large enterprises. Similar to Tableau, Qlik’s USP is an associative data model that allows users to explore data interactively through a simple point-and-click interface.
Some key features of Qlik include – in-memory associative data indexing for fast data loading, a robust data integration layer, and the ability to create intuitive dashboards. It comes with automation capabilities for repetitive data loads and refreshes. Qlik NPrinting helps deliver published reports on schedule.
Qlik offers licensing based on core/access-based models. The platform also provides cloud SaaS solutions. Qlik Sense is ideal for larger deployments that involve complex data models, while QlikView works better for simpler use cases. Overall, Qlik empowers knowledge workers and data experts for self-service analytics.
Read more: Data Analytics vs Business Intelligence: Key Differences Explained.
4. Domo
Domo is a modern cloud-based BI platform tailored for digital transformation initiatives of enterprises. It stands out with its low code/no code approach to help business stakeholders access and utilize BI tools independently without much support.
Domo supports clean room data integration across 800+ pre-built connectors. Data flows into a single source of truth through its patented data-wrangling engine. With drag-and-drop interfaces, users can quickly create interactive dashboards and mobile-friendly reports by uniting multiple analytics and data visualizations.
An integrated search capability helps easy discovery of relevant insights. Data preparedness features automate processes like data prep, blending, alerts, and more. It offers flexible consumption-based pricing plans suitable across organizations of varied sizes. Domo also emphasizes app store partnerships for out-of-the-box analytics apps.
Read more: Business Intelligence vs Big Data: Top Comparison Guide.
5. Looker
Looker is an agile analytics platform that delivers powerful visualization capabilities within an intuitive interface. It makes data approachable for all skill sets ranging from power users to casual business users.
Looker leverages an optimized query engine and multi-dimensional datasets to facilitate fast exploration. The embedded query language ‘LookML’ allows advanced customization and modeling of complex business logic. Users gain contextual insights through its natural language assistance on questions and patterns found in data.
A unique differentiator is Looker’s ability to support a wide range of BI use cases spanning dashboards, embedded analytics, reporting, data applications, and big data. It comes with 150+ pre-built blockchain and machine-learning connectors. AppGallery accelerates solution deployments through a marketplace of custom-built applications.
6. Sisense
Sisense takes a visualization-led approach to analytics by enabling discovery of hidden patterns using ‘In-Chip’ processing. It loads entire datasets inside its dedicated chips and performs processing at lightning speeds instead of traditional row-by-row approaches.
Notable features of Sisense include unified data modeling, cloud/hybrid deployment options, and pixel-perfect visualization wizardry to transform data stories. The funnels flow, and geo charts come pre-built for web and mobile experiences. Furthermore, business users can mash up custom widgets from curated templates.
For developers, Sisense provides SDKs, JavaScript libraries, and REST APIs to integrate analytics into web/mobile apps. It is a cost-effective choice suitable for diverse analytics requirements spanning embedded, analytics applications, and BI dashboards.
7. ThoughtSpot
ThoughtSpot centers search at its core to deliver instant analysis capabilities for end-users. Natural language search syntax supports questions on what, why, when, and how and returns visual explanations spanning multiple dimensions.
With its in-memory search analytics engine ‘SPOT’, ThoughtSpot allows exploring huge datasets up to billions of rows faster than traditional tools. It comes pre-configured with multiple domains like sales, marketing, support, operations, etc. for rapid deployment.
An AI assistant ‘CLARA’ helps profile users and recommends relevant datasets, measures, and visuals for analysis. The ‘Lens’ feature further simplifies the sharing of pre-packaged analytics apps developed by ThoughtSpot or peers through a Lens library. It targets businesses looking for powerful yet easy search-based analytics for end-users.
Read more: Business Intelligence vs Predictive Analytics: Key Differences Explained.
Conclusion
The business intelligence industry is progressively evolving to meet the growing demand for actionable data-driven insights. While many new entrants joined the arena, the ones highlighted above have stood the test of time and catered effectively across data volumes, complexity, and organizational maturity levels.
Mastering a few of these mainstream tools can accelerate your career paths as BI professionals, data analysts, or business stakeholders in thriving analytics domains. As data becomes more strategic to decision-making, demand for skilled talents proficient in these platforms will continue rising.
To stay ahead, consider CCS Learning Academy’s Business Intelligence courses. Offering hands-on training with industry-leading tools, CCS Learning Academy equips you with the expertise needed to thrive in the growing BI market. Our comprehensive courses are designed to help you gain the practical skills employers seek, ensuring you stay relevant and competitive in the data-driven business world.