
In the modern data-driven enterprise, business intelligence and analytics platforms empower people across roles to unlock impactful insights from data. With growing data volumes and complexity alongside constantly evolving stakeholder needs, selecting the right BI solution for your stack is crucial yet challenging.
This guide offers a detailed, side-by-side comparison between two best-of-breed options – Tableau and Looker across key factors like features, use cases, pricing, and more to help you determine the best fit for your needs in 2024 and beyond.
Tableau Overview
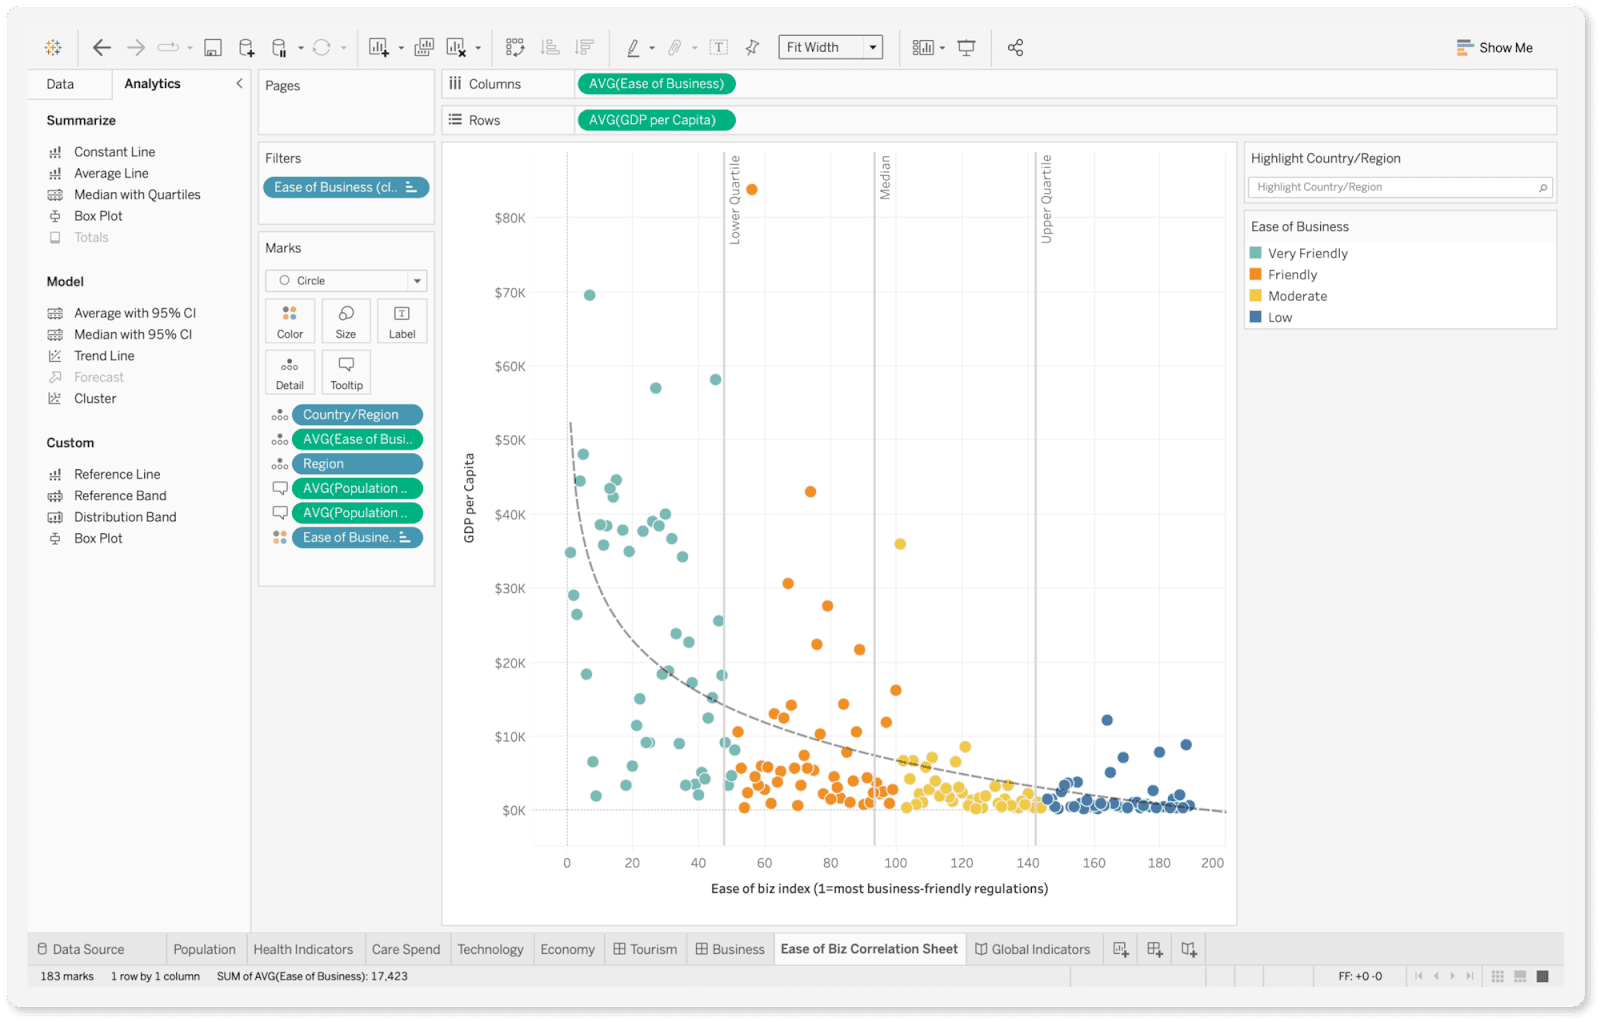
As a trusted end-to-end analytics platform, Tableau makes it easy for anyone to work with data through its intuitive, visual-focused user experience spanning dashboards, reporting, and predictive modeling – all designed to drive smarter decisions at scale.
With over 86,000 customers globally, Tableau integrates natively with 100+ data sources while leveraging AI innovations to guide users, regardless of technical skill level, as they explore information – making analytics accessible and understandable for all.
Tableau focuses on interactive data visualization capabilities for simplified analytics. Key features include:
- Drag-and-drop interface to visualize data sets
- Custom, sharable dashboards with advanced chart types
- Blending disparate data sources into unified views
- Real-time dashboard updates with fresh data
- Natural language queries (ask data questions in plain terms)
- Storytelling tools to craft data narratives and reports
Looker Overview
A unified data platform for BI and analytics, Looker provides the tools teams require to explore, analyze, and share real-time business insights using data modeling, AI-powered recommendations, and customizable data applications.
Trusted by over 2,000 customers globally, including Sony, Amazon, and The Economist, Looker seamlessly integrates analytics into workflows – allowing anyone to ask questions about their data while empowering experts with the flexibility needed for complex data transformations, enrichments, and analysis using Looker’s LookML programming language.
Some key capabilities and tools include:
- Powerful data modeling language (LookML) for advanced analytics
- Embedded analytics to integrate insights into web and mobile apps
- Scalable architecture to handle large, complex data sources
- Collaborative features for data sharing and team workflows
- Over 800 out-of-the-box data source integrations
- Intuitive visualizations and AI-powered natural language search
Tableau vs Looker: Comparison
Here is a comparison between Tableau and Looker:
1. Ease of Use
Enabling users across skill sets to intuitively access, understand, and act on data insights is crucial for the adoption of any analytics platform. Both solutions offer capabilities to make working with data approachable:
Tableau
- Drag-and-drop workflows to visualize data require no coding
- Interactive dashboards using natural language queries (Ask Data)
- AI-powered data interpretations (Explain Data) guide analysis
Looker
- Interactive data applications and dashboards built for business users
- Explore and filter data views without SQL coding skills
- AI-driven natural language search to discover insights
While Tableau prioritizes broader data democratization for all user personas through visual-first simplicity, Looker balances ease-of-use with customization breadth, targeting both technical and non-technical roles – each takes a different approach to improving data usability.
Tableau prioritizes intuitive workflows and visualizations so any user can assemble insights. Looker allows deeper technical customization but still empowers business teams through interactive dashboards. Both improve data accessibility in different ways.
2. Data Connectivity
The analytics platforms assessed support integrating data from a variety of sources – both cloud and on-premises – for analysis use cases.
Tableau
- 100+ native data connectors
- Live query data engine supports real-time connections
- Certified connectors to solutions like Snowflake, Databricks
Looker
- 750+ native data connectors
- A unified data model integrates sources into reusable components
- Certified connectors for data warehouses (Snowflake, BigQuery)
Both Tableau and Looker can connect to the most common enterprise data sources and warehouses, with Tableau having a slight edge in the total number of native connectors. Looker’s data modeling capabilities help analysts normalize disparate sources for unified analysis.
3. Analytics Capabilities
Modern BI platforms should offer a wide range of analytical and predictive modeling techniques to address diverse analytics use cases.
Tableau
- Interactive dashboards with advanced chart types
- Predictive modeling integrated through external engines
- Mapping with geographic data visualization
Looker
- Interactive web/mobile analytics applications
- Sophisticated Pivot analysis through LookML
- Mapping integrated natively
Tableau excels in interactive dashboarding, leveraging advanced integrated visualizations suited for data storytelling. Looker provides richer support for data applications that embed analytics directly into business workflows. Both support common analytical features like alerts, scheduled reports, and user filtering.
4. Data Preparation
Self-service data preparation empowers users to clean, transform, and enrich data prior to analysis while improving productivity.
Tableau
- Intuitive data interpreter recommends transformations
- Integrates with external ETL tools (Alteryx, Fivetran)
- Limitations handling large, complex data preparation
Looker
- LookML provides extensive data manipulation capabilities
- Seamless integration with data transformation tools
- Designed to handle large data volumes with optimal performance
While both platforms offer native data prep, Tableau’s capabilities focus on simpler use cases compared to LookML’s extensive functionality for handling large data volumes. Tableau users often leverage external ETL tools before analysis.
5. Augmented Analytics
Leveraging techniques like AI/ML, augmented analytics simplifies using data for smarter decision-making by automating insights discovery, alerting users to changes, providing next-step recommendations, and more.
Tableau
- Ask Data allows natural language querying
- Explain Data offers AI-generated insight explanations
- Einstein Discovery integration for predictive modeling
Looker
- AutoQL generates LookML and SQL queries using NL
- Smart Looker Blocks flag anomalies in data
- Uses external ML for predictive modeling
Both platforms effectively incorporate AI/ML to simplify finding insights. Tableau’s Einstein Discovery integration makes predictive analytics accessible without data science expertise. But Looker offers greater ML customization flexibility.
6. Embedded Analytics
Allowing analytics to be embedded directly into internal and external applications powers more informed decisions made within native workflows by various user personas.
Tableau
- Extensive APIs to embed interactive analytics
- Trusted by companies like Verizon, Charles Schwab
- Embedded analytics usage is priced separately
Looker
- Public APIs to integrate analytics experiences
- Embedded analytics included in base pricing
- Trusted by Sony, Hearst, and Udemy for custom apps
Both Tableau and Looker enable building analytics-powered apps at scale, playing a key role in the development of analytics-infused workflows, portals, and public sites. However, embedded scenarios may involve additional charges with Tableau.
7. Visualization and Dashboards
Flexible, highly customizable visualization combined with interactive dashboards for multi-faceted data storytelling is crucial for deriving actionable enterprise insights.
Tableau
- Highly intuitive drag-and-drop visualization
- Pixel-perfect design flexibility
- Interactive filtering, drill downs
Looker
- Custom visualization extensions using LookML
- Interactive dashboard drill-downs
- Limited design pixel precision
Tableau clearly is the leader when it comes to flexible, beautiful data visualization, allowing users across skill sets to create high-impact reports and dashboards. Looker prioritizes functionality over extensive design polish.
8. Collaboration
With data informing decisions across teams, BI platforms need to enable users to collaborate securely while standardizing on trusted metrics.
Tableau
- Annotation, commenting for context
- Governed self-service content publish
- Full governance for metrics standardization
Looker
- Discussion threads, annotations
- Git version control system
- Reusable LookML centralizes metric logic
Both platforms ensure users distribute insights securely with the right context added while standardizing logic centrally for a single source of truth. Tableau offers robust content workflows suited for larger deployments. Looker leverages reusable LookML and git versioning for metric definitions.
9. Scalability
The platform must flexibly scale analytics capabilities to meet the evolving demands of fast-paced enterprise environments building on big data.
Tableau
- Reliably scales compute needs leveraging Hyper
- Scales user access through centralized deployment
- Add resource capacity easily
Looker
- Multi-tier caching optimizes large data analytics
- Handles concurrent users through in-database arch
- Ability to scale cloud data warehouse needs
Tableau and Looker both effectively meet scaling demands for large user bases, increased data volumes, and complexity through a mix of elastic cloud architectures, optimized in-database analytics engines, and governance and management features that help manage scale.
10. Pricing and Support
Underestimating the true cost of software ownership beyond license fees to encompass maintenance, scaling, and growth support can significantly impact long-term value.
Tableau
- Per user pricing model ($35-$70 per user monthly)
- Additional costs for premium support, services
- New features offered through annual renewal
Looker
- Tiered pricing based on edition, users ($50-$150 per user monthly)
- Packaged pricing includes support services
- New capabilities are offered at no added cost
For companies prioritizing flexibility with lower risk, Looker’s unlimited use and transparent subscription pricing can make budgeting simpler and prevent surprise add-on costs as needs evolve. Tableau provides attractive entry-level pricing but may involve additional service fees.
Tableau and Looker Pros and Cons
Here is a detailed comparison of the pros and cons of Tableau and Looker:
Looker Pros
Customizable Platform
One of the biggest advantages of Looker is the ability to customize reports, dashboards, and data models to meet the unique needs of different teams or use cases. Unlike some business intelligence platforms with rigid workflows, Looker allows analysts to tweak visualizations, transformations, and more to provide tailored analytics. This makes it possible to deliver actionable insights to any department.
Scalability for Large Datasets
With its in-database architecture, Looker excels at handling large volumes of data while maintaining speed and performance. As underlying data sources grow larger, Looker allows for the scaling out of database capacity as needed. This computational distribution, combined with Looker’s optimized queries, ensures responsiveness even for complex analysis on billions of rows.
Flexible Data Modeling
At the core of Looker is LookML, a reusable modeling language for abstracting and transforming raw data into exploreable and understandable representations to serve diverse analytical use cases. LookML does the heavy lifting, so users without SQL skills can still analyze data effectively. It also enhances collaboration as developers build and refine models to empower data analysis across the business.
Free Tier for Evaluation
To allow potential customers to test it out, Looker offers a free Developer tier. Individual users can access core features on a limited basis to build models and prototypes before deciding if Looker meets their needs. This developer environment provides tangible, hands-on experience to estimate the potential value without any commitment.
Looker Cons
Ongoing Cost Considerations
Because it is a subscription-based SaaS platform, the long-term total cost of ownership is higher compared to free open-source tools. Per-user charges, which can exceed $100/month for advanced users, add up quickly across an entire organization. And as data needs to scale over time, cost predictability can be a challenge.
Customer Support Responsiveness
While Looker as a product has very positive reviews, some users report inconsistent experiences with the level and responsiveness of customer support. Response times to support tickets can vary significantly. This means you may occasionally need to follow up multiple times for resolution on complex issues.
Security Controls and Governance
As a multi-tenant cloud service, Looker has less customizable data security compared to on-premise BI options. Companies in regulated industries may require more granular control over data access, encryption methods, or compliance certifications, which dedicated instances can provide.
Tableau Pros
Intuitive Visual Interface
Tableau makes data visualization highly intuitive, even for non-technical users. With responsive drag-and-drop workflows and prebuilt template starting points, users can rapidly start uncovering insights. This allows a broader swath of employees to leverage analytics and eliminates dependence on technical specialists. The end result is faster, more decentralized, data-driven decision-making across more teams.
Sophisticated Interactive Visualizations
Tableau’s core strength is enabling self-service business analytics through rich, interactive data visualizations. Users can quickly slice and dice datasets, spot trends, and outliers visually, and drill down into details from millions of rows. Flexible dashboards facilitate understanding data and sharing discoveries across the organization through a common language.
Combined Single Source of Truth
Tableau’s data blending features allow users to import, prep and converge information from dozens of disparate sources like cloud services, on-premise databases, or local files. This consolidated view eliminates data silos and delivers a single source of truth to analyze. Tableau manages to connect this unified data picture regardless of the underlying components.
Tableau Cons
Challenges Handling Massive Data
While Tableau offers data blending and connector flexibility, running complex computationally intensive analysis on truly massive or unstructured datasets can impact performance. This computational overhead to query, join, and visualize hundreds of millions of rows introduces latency, which impedes rapid iteration.
Requires Additional ETL Layer
Tableau itself focuses primarily on downstream visualization and exploration rather than upstream data processing. This means organizations need a separate “EL” extract and load pipeline for tasks like cleaning, validating, and orchestrating upstream of Tableau. Data scientists may also utilize other dedicated predictive modeling tools before visualizing in Tableau.
Pricing Comparison
When evaluating business intelligence platforms like Looker and Tableau, it’s important to weigh their respective pricing models. This helps match the right solution to your organization’s analytics needs. Looker pricing consists of platform and user-based licensing fees, while Tableau pricing is primarily driven by role-based subscriptions.
Looker Pricing
The Looker platform starts at $5,000 per month for their Standard tier. Enterprise and embedded tiers require contacting Looker sales for custom annual contracts.
User licensing charges additional fees per user per month:
- Viewer: $30
- Standard: $60
- Developer: $125
Tableau Pricing
Tableau offers named user subscription plans billed monthly or annually with tiered pricing based on functionality.
- Creator user license: $70/user/month (cloud); $35/user/month (on-prem)
- Explorer user license: $42/user/month (cloud); $20/user/month (on-prem)
- Viewer user license: $15/user/month (cloud); $10/user/month (on-prem)
On-premise pricing is discounted, but the cloud model provides greater flexibility. Add-on costs can include additional ETL, storage, and services.
In summary, considerations around features, scalability, customization, ease-of-use, and cost model favorability help determine whether Tableau or Looker is a better fit as your organization’s business intelligence solution.
Conclusion
Tableau and Looker both deliver comprehensive, enterprise-ready business intelligence and analytics capabilities with some variability across strengths based on factors ranging from ease of use, breadth of analysis functionality, scalability needs, and pricing models.
Ultimately, aligning platform evaluation with key user personas and the challenges of analytics adoption faced by your organization helps determine the best fit. Tableau could be a preferred choice for broader self-service access through intuitive data visualizations.
For teams looking to ramp up their skills and adopt platforms like Tableau or Looker, CCS Learning Academy offers a range of analytics and BI courses. From introductory data literacy programs to advanced technical training on SQL, data visualization, dashboard development, and more, CCS Learning Academy helps learners master business intelligence.
Expert-led online classes, hands-on exercises, and mentoring ensure organizations can build proficiency to make the most of their BI software investment. By developing internal analytics experts through CCS Learning Academy’s skills-focused training, companies can accelerate data-driven transformation and business impact.