

Microsoft Excel and Power BI are two of the most popular data analytics and business intelligence tools used today. Excel has been around since 1985, while Power BI is a relatively newer offering from Microsoft having been released in 2011.
At first glance, both tools seem to have similar functionality – they help analyze data, create reports and dashboards. However, there are some key differences between the two tools that are important to understand.
In this comprehensive guide, we compare Power BI vs Excel across ten factors – data capacity, security, flexibility, visualizations, learning curve, accessibility, interactivity, cloud features, cost, and customization.
Understanding these differentiators helps identify which analytics solution better fits your business needs and use case – from personalized analysis to enterprise-grade reporting. Let’s dive in.
What is Microsoft Excel?
Released in 1985, Excel is likely a tool you are already very familiar with. It is a versatile spreadsheet application that is part of Microsoft’s market-leading Office product suite as well as their cloud-based Office 365 product.
Over the years, Excel has become ubiquitous in workplaces across functions. For example, it is extensively used in domains like finance, sales, marketing, human resources, operations and more for tasks ranging from data entry to reporting to visualizations.
At its core, Excel allows users to store, organize, manage and analyze various kinds of data in tabular form as worksheets. Users can build mathematical and logical models using in-built formulas and functions. Some of the most powerful features that make Excel a popular analytics tool are:
Formulas and Functions
Excel has a vast library of predefined formulas for common calculations that users can leverage. For expert users, Excel also allows combining multiple functions into a single custom formula tailored to specific analysis needs.
Presentation and Visualization
Once the analysis is done, Excel provides various visualization options like charts, graphs, and pivot tables allowing users to prepare interactive reports and dashboards with ease.
Productivity Tools
Microsoft offers various templates and enables features like data transformation tools that allow users to complete analytics tasks faster. Users can also create their own customizable templates.
Together, these features make Excel an extremely user-friendly and flexible analytics tool relevant for novices and experts alike. Due to its intuitive interface and simplicity, it is often one of the first analytics tools people encounter in their workplace
What is Microsoft Power BI?
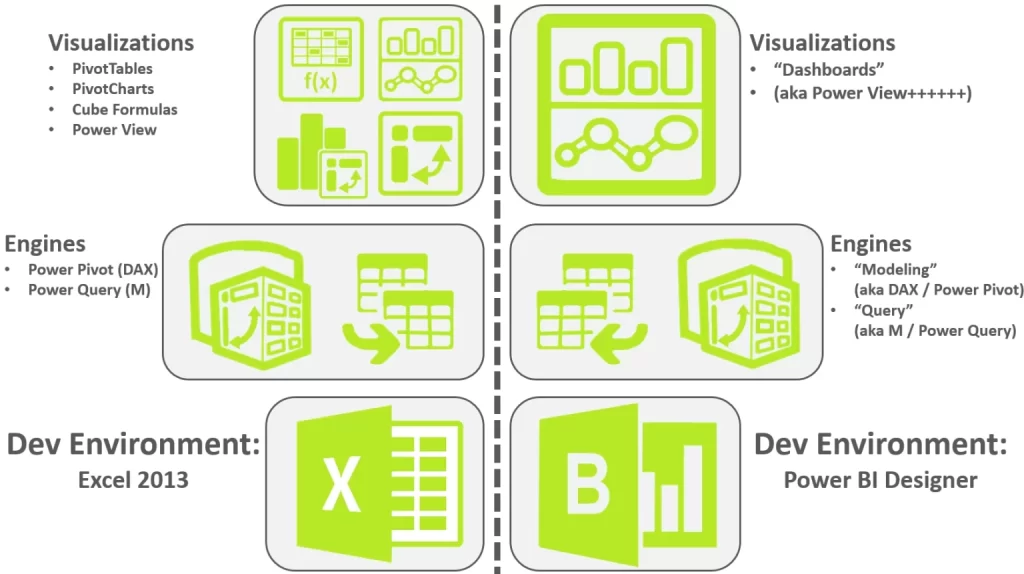
While Excel has been popular for over 30 years now, Microsoft introduced its dedicated business intelligence offering called Power BI in 2011. Power BI pulls together various capabilities from Excel as well as other products like Power Query, Power View and Power Pivot into one integrated environment specifically targeted at data analytics and building business intelligence solutions.
Unlike generic analysis use cases where Excel can be handy for individuals, Power BI is optimized for enterprise-wide analytics needs such as tracking key metrics and uncovering business insights to aid executive decision-making.
Here are some of the key features and capabilities of Microsoft’s Power BI:
Drag-and-drop Reports and Visualization
Much like Excel, Power BI provides an intuitive click-driven interface allowing analysts to create interactive reports and visualization without needing coding expertise. The visualizations are highly customizable too.
Data Connectivity and Transformations
Power BI pulls data from numerous sources like Excel itself, databases, websites, applications etc. using connection strings and queries. It can join data from multiple sources into one view. The Power Query tool helps transform data easily to prepare it for analysis.
Dashboards and Sharing
Reports and dashboards can be published to the Power BI service and shared securely across an organization. Users access them using mobile and web apps enabling easy adoption for data-stories.
Artificial Intelligence
Power BI intelligence capabilities take analytics to the next level with machine learning-driven features like natural language queries, anomaly detection, forecasting, sentiment analysis etc. helping automate tasks.
Power BI takes Excel’s analysis foundation and adds scalability, collaboration and automation capabilities on top making it an indispensable full-stack business intelligence tool.
Similarities Between Excel and Power BI
Despite their differences in terms of capabilities and ideal use cases, Power BI and Excel have some common traits.
Firstly, the interface of both tools features a familiar ribbon that houses various menu-driven functionality options. Similarly, both tools show visualization customization side panes. These consistent Microsoft design elements allow some interface familiarity for users of these tools.
Secondly, the fundamental data transformation capabilities utilizing Power Query are common across Excel and Power BI. Analysts can bring in data from diverse sources, and then clean, shape, and enrich it to prepare for analysis similarly in both tools.
Finally, Excel and Power BI share several basic visualization chart types like bar graphs, pie charts, scatter plots etc. Both tools can also connect to Microsoft data sources like SQL Server and Analysis Services. Users can leverage Excel and Power BI in conjunction thanks to native integration capabilities.
Also, templates and reusable components help kickstart analytics in both tools. In Excel, users can browse pre-defined templates from Microsoft or third parties for various use cases. In Power BI, publishers distribute templatized reports in the form of apps. Similarly, analysts can save Power BI report sections as personal report templates for reusability.
Power BI vs Excel: Top 10 Differences
There are some fundamental differences between the two tools in terms of scale, access control, customization, and more. Understanding these distinct capabilities helps determine which situation calls for Excel, Power BI or even a combination of both tools for optimal results.
1. Data Capacity
One major difference between Excel and Power BI is the volume of data each can handle for analysis and reporting.
Excel workbooks allow loading up to 1 million rows and 16,000 columns per worksheet. Beyond this volume, workbooks struggle to open fully. Even for smaller datasets, large reports slow down analytical performance.
In contrast, Power BI easily handles millions of rows, with capacity limits based on available cloud storage. By leveraging compression and selective data loads, Power BI delivers fast interactive analysis on vast datasets.
Verdict: For small datasets, Excel suffices. But for enterprise-level data, Power BI is better equipped for responsive visualization and modeling.
2. Data Security
Excel provides basic security measures like worksheets or file passwords. But if you share full Excel reports via email or networks, underlying data stands exposed.
Power BI only exposes reports to consumers, not the entire dataset. Admins control granular data access permissions and security policies, enabling safer external sharing.
Verdict: Power BI enables more secure analytic data sharing, crucial for sensitive organizational data.
3. Flexibility
Excel offers immense layout flexibility to build customized, fluid dashboards and models using wide-ranging inbuilt functionality. Users can analyze data in their own unique way in Excel.
Power BI trades off open-ended flexibility for usability guardrails and automation. While it has customization options, tooling promotes standard modeling practices for cleaner aggregated analysis.
Verdict: Excel has richer flexibility for personalized analysis needs. Power BI focuses more on reusable enterprise reporting.
4. Learning Curve
Released in 1985, Excel is a ubiquitous product most are already adept at. From students to senior executives, a wide user base leverages Excel for calculations, data visualization, and basic analysis.
The relative newcomer Power BI requires more specialized analytics skill sets around data modeling, DAX formulas, and report design. The learning curve is steeper than simply getting started with Excel.
Verdict: Excel is significantly easier to start learning and using over Power BI.
5. Accessibility
Excel offers offline desktop accessibility and makes sharing analysis possible by forwarding workbook files. But it lacks inherent collaboration capabilities.
Power BI publishes reports on the cloud-based Power BI service for easy access across devices. Online sharing allows teams to interactively consume analytics.
Verdict: Power BI enables more accessible and collaborative analysis for dispersed teams through cloud-based access.
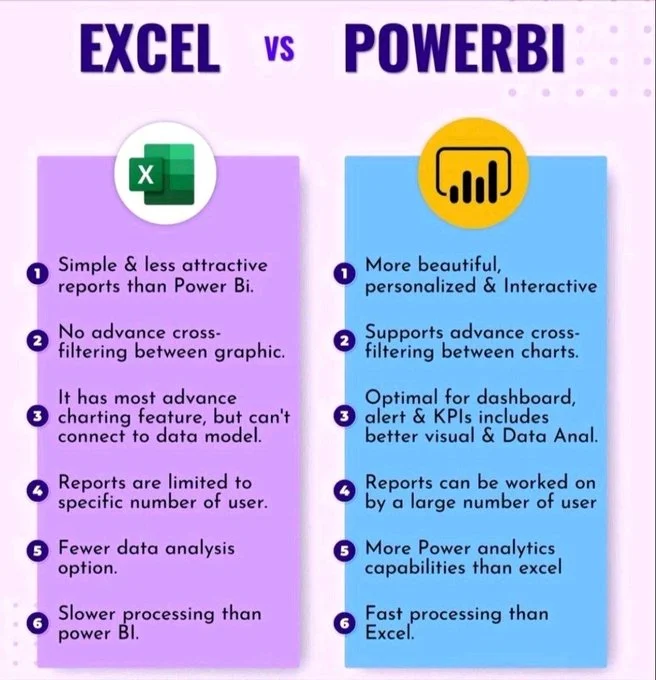
6. Visualization Options
Excel offers a standard gallery of about 25 visualizations like line charts, pivot tables, and histograms to analyze data.
Power BI builds on Excel’s base visuals with over 45 specialized variants. Users can also access custom visualizations for niche analysis needs from the integrated marketplace.
Verdict: Power BI provides far richer, customizable visualization diversity for multidimensional insights.
7. Interactivity
In Excel, slicers help filter data displayed in charts by selected dimensions. This rudimentary interactivity limits multi-faceted data exploration.
With Power BI, users can slice and dice datasets using various filters, highlights, Conditional formatting, bookmarks, and drill-through capabilities. This drives a more intuitive analysis.
Verdict: Power BI enables deeper interactive data analysis with its advanced filtering and discovery features.
8. Cloud-based Capabilities
Excel lacks native cloud features. Sharing insights means emailing workbooks or using third-party file-sharing tools. This fragments data access and hampers collaboration.
Power BI publishes reports to a responsive cloud service allowing users to seamlessly find, share, and discuss analytics. Centralized content promotes organizational alignment.
Verdict: Power BI’s integrated cloud platform gives teams a common ground for data-driven decision-making through easy report access.
9. Cost
Excel comes bundled with Microsoft 365 licenses commonly used in most organizations, making it readily available for users at no added cost.
Using the Power BI desktop for analysis is free. However, accessing the managed cloud service for publishing and sharing reports requires a Pro license at $9.99 per user monthly.
Verdict: Excel provides cheaper analysis access. Power BI costs more but unlocks collaboration capabilities through cloud-based sharing.
10. Customization
Excel exposes the full breadth of its functionality to blend data from various sources into customized visualizations and analysis using formulas and macros.
While Power BI also consolidates data across sources, it renders visuals using predefined DAX measures. Customizations to calculations, queries, and visual properties are accessible but limited.
Verdict: Excel has a richer scope for DIY analysis with in-depth user-driven customizations compared to largely codeless Power BI.
Choosing Between Excel or Power BI
Depending on the analytics context and stakeholder needs involved, often Excel and Power BI can complement each other together as part of an overall business intelligence strategy. But some guiding principles can steer appropriate tool selection:
Volume of data
For small, well-bounded analysis needs without major row expansions, Excel provides ample analytical value right out of the box. But larger enterprise data workloads and intricate relationships definitely warrant Power BI’s robust modeling and scalability.
Customization drive
If proprietary calculations, macros, and premium user control over analysis techniques are paramount such as customized sales planning scenarios, Excel empowers such flexible modeling. However, standardized visibility using KPIs into shared organizational data assets gets streamlined through Power BI.
Skill sets and learning considerations
Self-service users already adept at Excel formulas can extract further value with some upskilling. Upskilling entire teams on multi-dimensional data modeling needed for Power BI adoption likely involves heavier lifting and costs. But long-term dividends likely justify investments in such new expertise.
Collaboration requirements
Isolated analysis confined to an individual user’s PC aligns better with Excel’s strengths. But wider content sharing, interactive discussions, and centralized data oversight call for Power BI’s vast social and cloud-powered features.
Budgetary approvals
With prevalent Office tooling, no major incremental costs make Excel a safe personal analysis bet for users. But company-wide Power BI rollouts being costlier might need some careful projection of total value derived vs license and change management investments.
The Excel vs Power BI choice ultimately hinges on the context specifics like users, use cases, custom needs, data sources, etc. Rather than an either-or-binary decision, often integrated utilization produces optimal results. Excel offers wide-open flexibility that can feed cleaner aggregated data into Power BI for beautiful interactive dashboards enjoyed enterprise-wide!
Key Takeaways
Here are the main conclusions from our 10-point Power BI vs Excel comparison:
- For personalized, small-scale analysis without governance needs, Excel adds value through considerable data customization flexibility.
- For securely governed, large-scale enterprise reporting with rich insights, Power BI is the better direction to pursue.
- Power BI also overshadows Excel on advanced features like diverse visualizations, intuitive interactivity, and easy cloud sharing.
- Excel continues to have merits where lightweight ad-hoc analysis without IT support is needed by autonomous business users comfortable with spreadsheets.
The optimal tool for your business intelligence needs depends on the specific use case context – volume, user skill sets, customization needs, and cross-team sharing requirements. Of course, both tools can complement each other across an organization’s BI strategy too.
Conclusion
As seen from the detailed 10-point comparison between Excel and Power BI, both tools have merits in the right situation. While Excel covers simple analysis needs requiring customization flexibility, Power BI unlocks deeper governed insights through advanced modeling and enterprise-sharing capabilities.
For professionals and organizations aiming to level up their analytics game, acquiring Power BI mastery should be a priority. The CCS Learning Academy’s Microsoft Power BI Data Analyst course can perfectly catalyze that expertise development journey.
The interactive course delivers extensive hands-on learning using real-world datasets on all key aspects of Power BI – from connecting data sources and shaping data to building visually rich reports, creating insightful dashboards, and configuring enterprise-grade governance.
Experienced instructors walk you through detailed demonstrations while sharing pro tips and best practices honed from hundreds of successful BI deployments. By the course end, you gain broadly applicable skills to architect BI solutions personalized to your organizational needs.
Whether preparing for Microsoft’s prestigious Power BI certifications or aiming to lead adoption in your workplace, this skill-building course sets you up for success through structured learning modules, engaging exercises, and inspiring project work.
With the CCS Learning Academy advantage powering your Power BI journey, you will soon confidently unlock hidden insights to transform decision-making using Microsoft’s leading analytics platform.


