With data and analytics becoming central to digital transformation efforts, Microsoft offers two compelling platforms – Microsoft Fabric and Power BI. Both aim to streamline working with data but in different ways.
This extensive guide will compare Microsoft Fabric and Power BI across various factors like architecture, features, security, use cases and integration to help you determine which technology or combination thereof is the best fit. Let’s get started!
Table of Contents
- Microsoft Fabric Overview
- Power BI Overview
- Microsoft Fabric vs Power BI Comparison
- Integrating Microsoft Fabric and Power BI
- Prerequisites
- Step 1 – Create a Fabric Workspace
- Step 2 – Build a Lakehouse for Raw Data
- Step 3 – Import Data into Fabric
- Step 4 – Transform Data in Fabric
- Step 5 – Create Curated Views of the Data
- Step 6 – Load Curated Data into a New Lakehouse
- Step 7 – Expose Lakehouse data via SQL Endpoint
- Step 8 – Connect Power BI to the Endpoint
- Step 9 – Model Data in Power BI
- Step 10 – Build Reports and Dashboards
- Conclusion
- FAQs
Microsoft Fabric Overview
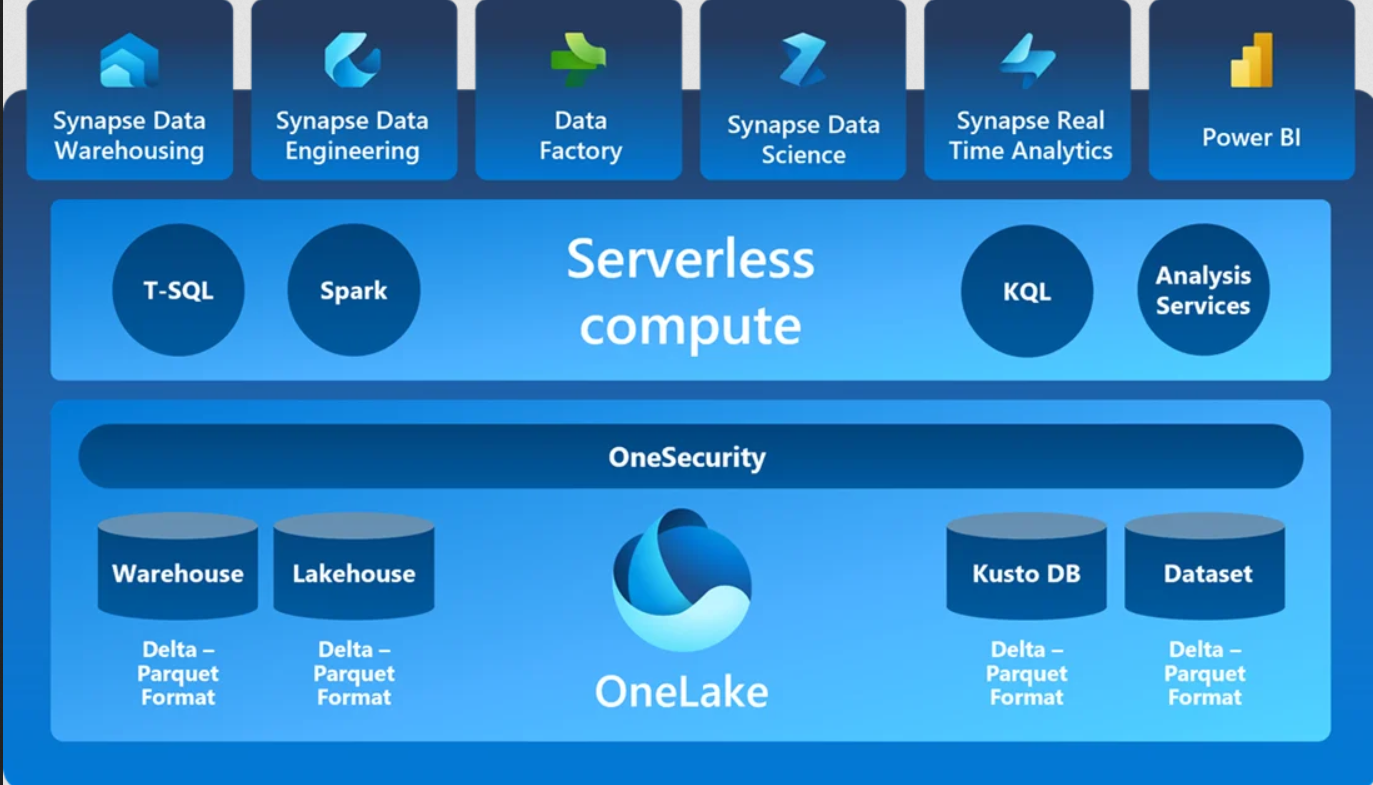
Released as a preview in 2022, Microsoft Fabric brings an integrated approach to enterprise data analytics. The managed cloud platform weaves together data integration, storage, processing and insights functionality into a unified data fabric architecture.
Microsoft Fabric consolidates Azure data services like Synapse Analytics, Azure Data Explorer and Azure Data Factory, and Power BI under one umbrella. This eliminates the need to leverage disjointed solutions saving time and complexity.
Key Features:
The key capabilities offered by Microsoft Fabric include:
- Data integration: Ingest, replicate and connect data from 100+ first and third-party sources through drag-and-drop ease. Built-in connectors expedite access to common systems like SQL Server and Oracle without coding.
- Centralized data lakehouse: Store structured, unstructured and semi-structured data in open formats in a single pane-of-glass using Azure storage technology. This enables unified governance. Quickly process any data volume or file type leveraging the versatile Azure architecture.
- AI-powered analytics: Embed machine learning within data workflows to automatically filter anomalies, drive personalization or generate forecasts without dedicated data science resources. Azure Machine Learning integrates tightly enabling advanced analytics.
- Real-time analytics: Analyze streaming data feeds with virtually zero latency using Azure Stream Analytics for time-critical insights. In-database processing avoids data movement. Create alerts for immediate notifications.
- Data visualization: Build interactive reports, dashboards and apps using Microsoft Power BI leveraging its vast data connectivity and industry-leading visualization capabilities. Fabric enhances collaboration.
Use cases:
As an integrated data platform, Microsoft Fabric is ideal for:
- Implementing automated, industrialized data lifecycle processes from end to end
- Operationalizing artificial intelligence and machine learning models
- Building customer 360 applications with integrated analytics
- Simplifying data engineering through no-code experiences
Limitations:
- Limited talent pool and community resources
- Not viable as a standalone BI visualization solution
Microsoft Fabric adopts a multi-tenant architecture wherein each customer receives a dedicated cloud-hosted environment called Fabric Tenant. This isolates data and workloads for security while permitting customization. Let us now understand Power BI’s architecture.
Power BI Overview
Released in 2015, Microsoft Power BI quickly became a widely used business intelligence platform. It targets intuitive data visualization and actionable insights. The self-service functionality empowers even business teams without extensive technical expertise to carry out data analysis.
Key features:
Features that make Power BI invaluable for data reporting and dashboarding include:
- User-friendly visual interface: The click-driven Power BI desktop environment enables intuitive report and dashboard creation using drag-and-drop. Generating rich charts, graphs and layouts takes minutes without programming skills.
- Smart data discovery: AI-driven insights surface interesting trends, variations and relationships in data that humans can easily miss given data volumes. Natural language queries via the Q&A interface provide quick answers.
- Data connectivity: Directly access 100+ data sources encompassing on-premises or cloud databases, Microsoft business apps, Open Data protocol sources like SharePoint and third-parties like Salesforce. No staging required.
- Augmented analytics: Embed state-of-the-art machine learning within analysis workflows via Azure ML integration e.g. forecasts using automated time-series modeling. Democratizes cutting-edge techniques.
- Collaboration: Share reports securely across teams and organizations fostering alignment through trusted data. Interactive dashboards empower users to slice data on the fly without dependencies.
Use cases:
Power BI shines when it comes to:
- Interactive self-service data visualization and discovery
- Building interactive sales, marketing, and executive dashboards
- Operational reporting and real-time monitoring
- Embedding analytics directly into custom applications
Limitations:
- Advanced data transformation capabilities require knowledge of M language
- Modeling large and complex data can be challenging
- Limited governance, security and auditing functions
Power BI employs a multi-tier architecture with distinct desktop development, cloud service and mobile applications tiers providing environment isolation and enhanced user experience. Now that we understand both platforms, let’s compare Microsoft Fabric vs Power BI.
Microsoft Fabric vs Power BI Comparison
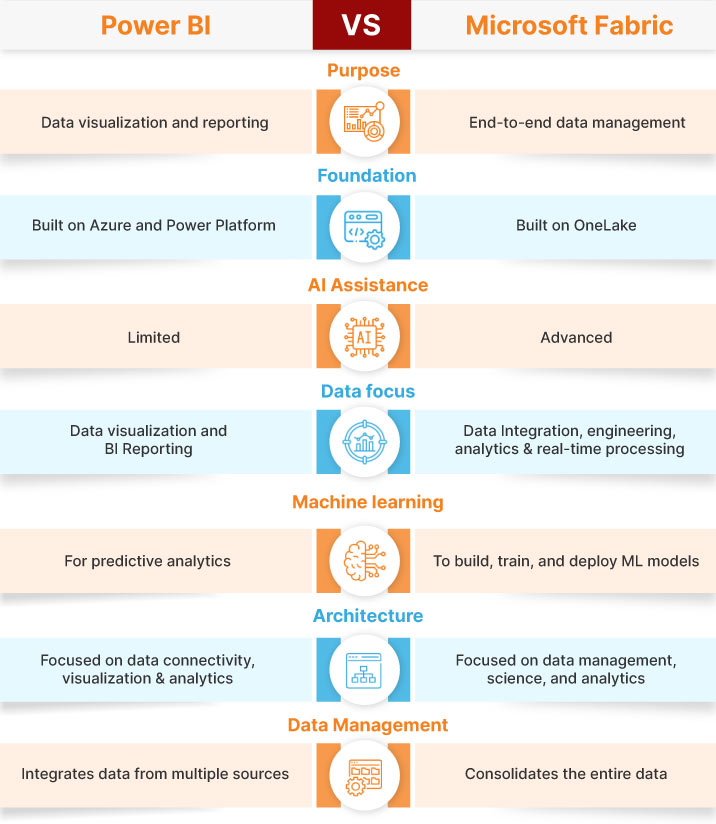
We will analyze how Microsoft Fabric and Power BI compare across 8 vital parameters – purpose, audience, architecture, ease of use, security, capabilities, use cases and integration.
1. Purpose
As an integrated enterprise data platform, Microsoft Fabric intends to bring together otherwise disparate services involved across data pipelines – integration, storage, processing, analytics and visualization. Doing so simplifies delivering holistic solutions that make data accessible and actionable for diverse teams in flexible but governed ways.
In contrast, Power BI specifically focuses on enabling stunning interactive data visualizations through charts, graphs and dashboards. It targets simplifying that one downstream workflow concerned with extracting business insights once data is already integrated, prepared and modeled.
2. Audience
Given its end-to-end scope spanning data management, warehousing, data science and business intelligence, Microsoft Fabric covers extensive data roles ranging from engineers and scientists to analysts, insights consumers and leadership. IT teams would also use Fabric extensively for its cloud resources.
Instead Power BI directly serves the reporting, analytics and decision-making interests of business teams across functions like sales, marketing, finance and operations. With its self-service bent allowing data exploration without deep technical skills, business power users, analysts and ground staff form Power BI’s core users in addition to data stewards catering to them.
3. Architecture
As highlighted earlier, Microsoft Fabric utilizes a multi-tenant cloud architecture to provide isolated and dedicated environments called Fabric Tenants for each customer. Resources are pooled allowing optimized sharing. But customization and secured data separation provide the desired flexibility.
Power BI leverages a multi-tier architecture separating out desktop tooling, cloud services and mobile applications responsibilities. Usage typically initiates via the Power BI desktop used to connect data sources, transform, model data and create reports. Developers then publish finished reports to the responsive Power BI cloud service for content sharing access including on mobile devices.
4. Ease of Use
Getting started with Microsoft Fabric requires a significant upfront investment to understand the purpose and capability scope of its numerous components – Power BI, Azure Data Factory, Purview, Synapse Analytics etc. Each addresses specific use cases. Orchestrating end-to-end solutions needs careful expertise around tool selection, sizing and integration.
In contrast, Power BI provides an intuitive, user-friendly interface making it relatively easy for business teams to create and disseminate reports and dashboards compared to Fabric’s learning demands. However, realizing Power BI’s full potential still requires deeper understanding of visual best practices, performance tuning etc necessitating expert guidance.
5. Security
As a managed cloud service, Microsoft Fabric delivers robust access controls, auditing, data protection policies and compliance capabilities like any Azure offering. For example, conditional data access policies secure sensitive data while data loss prevention features detect risky data flows with automated response mechanisms. Such facets make highly regulated workloads easier to manage in Fabric.
Similarly, Power BI also delivers enterprise-grade security necessary for trusted data sharing and governance without compromising insights access for authorized consumers. Row-level security, data classification and sensitivity labels, usage monitoring and data certification workflows prevent leakage while enabling broad self-service access. But Fabric provides richer nuanced policy controls given its wider platform scope.
6. Capabilities
Reflecting its integrated focus, Microsoft Fabric empowers complete lifecycle needs – ingesting data from within and outside the organization into cloud storage, applying onboard data science, analyzing real-time and batch feeds, applying machine learning and serving the curated outputs to decision-makers through business intelligence tools.
Instead, Power BI concentrates on enabling data practitioners to easily connect with curated data sources, create visually rich reports and dashboards surfacing desired business metrics and share these interactively with intended stakeholders through its cloud service. So the capabilities orient more toward responsive visualization and insights consumption rather than extensive backend data processing.
7. Use Cases
As a versatile platform, Microsoft Fabric applies across a wide spectrum of data scenarios – from capturing and refining a single source of truth for master data to detecting emerging trends through AI-based real-time analytics to disseminating insights through reporting. This makes Fabric relevant across industries and functions with data-centric processes to optimize.
Power BI though squarely targets business intelligence priorities – monitoring operations via interactive KPI-focused dashboards, uncovering customer behavior patterns in marketing data lakes to guide campaigns and promotions or simplifying budget versus actual financial reporting etc. So it enables intuitive data exploration primarily for business data consumers rather than hardcore data engineers or scientists.
8. Integration
As highlighted earlier, Microsoft Fabric innately integrates Azure data technologies like Synapse Analytics, Data Factory and Azure Machine Learning alongside non-Azure services – ranging from Power BI to third-party applications. Unified data security, governance and administrative ease are built in through Azure.
Individual components also work well in a standalone fashion with other apps e.g. Power BI easily ingests data outputs from Fabric pipelines or third-party apps via its extensive connectivity support and even allows embedding visualizations within custom apps. So complementary usage becomes feasible even across portfolios for enriched experiences.
Integrating Microsoft Fabric and Power BI
Microsoft Fabric and Power BI perfectly complement each other. An integrated solution allows harnessing Fabric’s robust data engineering capabilities while retaining Power BI’s simple and powerful analytics features.
Here is an end-to-end demonstration of setting up such an integration:
Prerequisites
- Sign up for the Microsoft Fabric preview
- Download sample Contoso data template for Power BI
Step 1 – Create a Fabric Workspace
- Log in to Microsoft Fabric and create a new workspace
- Allocate compute and storage by selecting a Fabric capacity like Developer or Production
- This canvas will serve as the control plane for pipelines and integration
Step 2 – Build a Lakehouse for Raw Data
- Lakehouse acts as the storage layer in Fabric and will hold raw data
- In the workspace, select New > Lakehouse > Enter name like “RawSalesLakehouse” > Create
- This creates a storage account, file system, and Sales database
Step 3 – Import Data into Fabric
- Click on the Lakehouse to enter its management interface
- Select Power Query Online to open the data preparation tool
- Import the Contoso sales template downloaded earlier
- Select relevant entities like Customers, Products, Transaction tables
- Click Save and Publish to store query results back to the Lakehouse
Step 4 – Transform Data in Fabric
- Re-edit the queries and make any data cleansing tasks like removing duplicates
- For example, deduplicate Product list based on the ProductID column
- Aggregate Transaction data to a daily level instead of individual sales
- Use in-built data manipulation capabilities to transform source data
Step 5 – Create Curated Views of the Data
- Rather than directly exposing raw data to BI tools, create curated views
- For example, build an aggregated FactSales table and Dimension tables for Customers, Products, Date, and Location
- Expose these to BI tools for easier modeling and governance
Step 6 – Load Curated Data into a New Lakehouse
- Create another Lakehouse called “CuratedSalesLakehouse”
- Add transformed Customer, Product, and Sales tables as destinations within the dataflow
- Upon publishing, this new Customer 360 database gets created under the CuratedSalesLakehouse
Step 7 – Expose Lakehouse data via SQL Endpoint
- Back in the Fabric workspace:
- Select the CuratedSalesLakehouse > Create SQL Endpoint
- This generated SQL database allows running analytics queries against the Lakehouse
Step 8 – Connect Power BI to the Endpoint
- Open Power BI Desktop and get data from the SQL Endpoint
- This Power BI dataset now reflects all the transformed data from the Lakehouse
Step 9 – Model Data in Power BI
- Structure data by establishing relationships between entities
- For example, join the FactSales table to DimCustomer, DimProduct and DimDate tables
- Create roles, row-level security roles, and calculated columns if needed
Step 10 – Build Reports and Dashboards
- Author interactive reports with various charts, tables, and matrices to analyze the data
- Create and publish dashboards with report visualizations
- Manage permissions on who can view and edit contents
Conclusion
As seen from our exhaustive analysis, Microsoft Fabric and Power BI serve complementary needs in the data analytics space despite some architectural and capability overlap.
Microsoft Fabric shines where end-to-end data management, storage, processing, and dissemination are needed across the data lifecycle. It streamlines assembling such integrated solutions through pre-built connectors between Azure data services like Data Factory, Synapse and Purview. Rich functionality in areas like data science, real-time streaming and data warehousing make Microsoft Fabric a versatile analytical data platform.
In contrast, Power BI delivers exceptional business user-friendly data visualization and reporting. With its self-service model aligned with business intelligence priorities, Power BI democratizes data, freeing it from technical gatekeepers. Intuitive drag-and-drop authoring combined with a natural language interface fosters data exploration, insightful dashboards, and broader adoption across the enterprise.
Ultimately, based on use case nuances around scale, security, processing depth or accessibility requirements, and skill resource availability, organizations can opt for Microsoft Fabric or Power BI independently or in conjunction to build comprehensive analytics solutions aligned with strategic data objectives.
For intermediate analytics practitioners seeking to skill up on Microsoft’s Power BI platform and unlock its immense potential for stunning data visualization and actionable business insights, the Microsoft Power BI Data Analyst Course from CCS Learning Academy is an ideal choice.
The structured video course is designed by expert Power BI practitioners and delivers extensive hands-on training leveraging real-world datasets.