In today’s data-driven business world, the terms ‘Business Intelligence’ and ‘Business Analytics’ are commonly bandied about. While both concepts revolve around analyzing organizational data to gain insights, understanding the differences between them is vital to leverage these tools effectively.
This article delves deep into distinguishing Business Intelligence from Business Analytics, comparing their key features, use cases, tools, and more. We’ll also explore how integrating both approaches can supercharge data-driven decision-making.
Table of Contents
- What is Business Intelligence?
- What is Business Analytics?
- Key Differences Between Business Intelligence and Business Analytics
- How to Determine Your Business Intelligence and Analytics Needs
- Integrating Business Intelligence and Business Analytics for Enhanced Outcomes
- What’s Next: Embarking on Your Data-Driven Analytics Journey
- FAQs
What is Business Intelligence?
Business Intelligence, commonly referred to as BI, refers to technologies and tools used to collect, store, and analyze historical and present data within an organization. The overarching goal of BI is to help business leaders and managers sift through this information to better comprehend operational performance.
Some of the main attributes of BI include:
- Retrospective focus: BI chiefly examines past and present operational stats to provide a rear-view mirror view of business metrics.
- Dashboards and reporting: Key BI tools encompass dashboards, scorecards, and reports to track key performance indicators (KPIs) over time.
- Operational efficiency: The insights from BI are applied to optimize existing business processes, enhance productivity, and improve operational efficiency.
- Large-scale implementation: Due to its retrospective nature and focus on operational metrics, BI traditionally involves massive implementations across large enterprises.
- Decentralized information: BI amalgamates disparate internal and external data sources into a unified view to facilitate informed decision-making.
Popular BI software encompasses the likes of Microsoft Power BI, Tableau, Qlik, SAP Analytics Cloud, and more. Companies leverage BI to gather actionable business insights, spotlight issues or anomalies in operations, and take prompt corrective steps.
What is Business Analytics?
Business Analytics, often abbreviated as BA, involves a more futures-oriented analysis of organizational data compared to BI.
Some distinguishing qualities of BA include:
- Predictive focus: Rather than just recording past performance, BA aims to forecast future trends, behaviors, and outcomes through predictive and prescriptive models.
- Hypothesis testing: Analysts leverage BA techniques like data mining and machine learning to formulate and test hypotheses.
- Decision optimization: BA supports not only understanding what happened but also evaluating various ‘what-if’ scenarios to determine the best decision or course of action.
- Applicable at all scales: While BI traditionally requires large-scale implementations, the analytical scope of BA means even smaller companies can adopt these techniques.
- Self-service provision: Advanced BA tools allow business/divisional users to independently analyze datasets and derive findings.
Popular BA tools encompass Excel, Tableau, Microsoft Power BI, and Google Analytics along with specialized offerings like Looker, ThoughtSpot, SAS, and Splunk. BA empowers businesses to look around the corner by leveraging both structured and unstructured data sources.
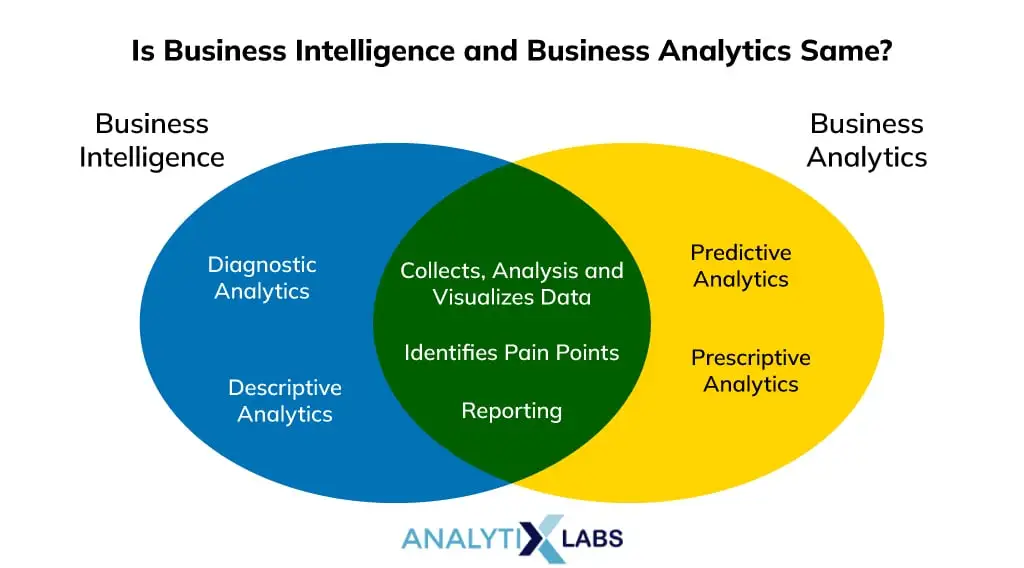
Key Differences Between Business Intelligence and Business Analytics
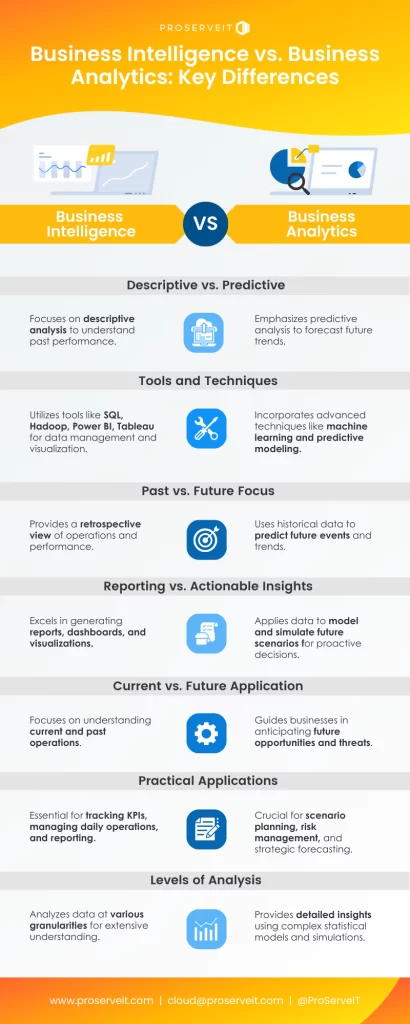
While BI and BA undoubtedly overlap in certain areas, there are fundamental distinctions between the two in terms of goal, use, implementation, and scope:
Focus
Business Intelligence (BI) focuses on reporting and tracking historical metrics in order to gain insights into past operational performance and efficiency. BI looks backward at collected and structured data from sources such as enterprise resource planning (ERP) systems and customer relationship management (CRM) systems. It aims to help managers understand what has already occurred and make incremental improvements.
On the other hand, Business Analytics (BA) comprises analytical techniques applied to the same historical data sources as well as other internal and external sources in order to foresee and predict future trends, patterns, and outcomes. BA aspires to proactively shape what has not yet happened by anticipating likely scenarios based on past events and behaviors.
Usage
BI aids current business decisions and ongoing management of day-to-day operations by revealing what has worked well or not so well beforehand. The performance metrics and key performance indicators illuminated by BI dashboards and reports enable continuous monitoring and minor tweaks to existing processes and strategies.
Conversely, BA supports strategic decisions not only for present operations but also for future planning through carrying out predictive and prescriptive analysis. By developing statistical models analyzing past data, BA facilitates forecasting of likely opportunities and threats ahead so that businesses may effectively position themselves and take advantage.
Implementation
Due to the scale of data amassed and the complexity of questions addressed historically, BI solutions traditionally involve large-scale and long-term rollout projects stretching over many months or years and requiring sizable budgets, especially across huge enterprises with myriad global subsidiaries and divisions. This makes BI beyond the immediate means of small to medium-sized businesses (SMBs) with more constrained resources.
Conversely, even SMBs may adopt selected BA techniques and tools for targeted analytics use cases regarding particular products, customers, or processes. Various affordable BA tools nowadays allow SMBs to benefit from advanced analytics without tremendous investments.
Analysis
While BI predominantly relies on structured and numeric transactional data stored in databases for straightforward reporting and visualization of metrics, BA additionally leverages both structured and unstructured internal and external data sources for predictive modeling. This includes qualitative sources such as customer support transcripts, social media conversations, and news articles in addition to usual metrics.
BA applies sophisticated statistical techniques like machine learning, text mining, and sentiment analysis to gain actionable insights hidden within vast volumes of structured and unstructured data.
Tools
Common software solutions under the banner of BI include interactive dashboards, scorecards, and basic reporting applications equipped with tools for slicing and dicing metrics according to different dimensions. These allow tracking key indicators over time for process oversight.
Advanced BA tools feature not only intuitive interfaces for data exploration but also machine learning algorithms, automated model building, hypothesis testing, and data mining capabilities on top of the usual reporting. This equips analysts with means for predictive pattern recognition, forecasting, and prescriptive guidance.
Scope
While useful for all sizes and types of organizations, BI solutions often need to encompass broad data covering extensive historical performance across many divisions, locations, and product lines for complex enterprises. The scale of past performance analysis involved bloat projects and prolonged rollouts.
BA meanwhile scales flexibly, from targeted projects addressing certain processes to economy-wide macroeconomic modeling. Even smaller businesses can perform meaningful BA concentrating investigative scope as needed, without necessitating enormously intricate or costly undertakings that may overwhelm limited budgets or skills.
Users
Traditional BI targets specialty users such as data analysts, reporting specialists, managers, and executives trying to make sense of performance indicators. Meanwhile, BA empowers frontline roles also like customer support agents, salespeople, and medical professionals by serving up automated insights and “self-service” functionality for exploring available organizational data independently when desired without IT assistance. BA puts fact-based guidance within easy reach of a much broader range of operational roles for the enhancement of customer and stakeholder experiences.
Keeping these nuances in mind is key to comprehending how precisely to leverage the right combination of BI and BA methodologies for optimal business gain. Both are complementary rather than mutually exclusive.
How to Determine Your Business Intelligence and Analytics Needs
The first step to developing an effective BI/BA strategy is gaining an understanding of the specific business problems and opportunities that quality data-driven insights can address.
Here are some questions to ponder:
- What key metrics (sales, customers, inventory, etc.) directly impact profits?
- Are there specific processes (production, fulfillment, etc.) that could use optimization?
- Are there patterns of customer behavior yet to be discovered?
- Which divisions of the business would most benefit from predictive forecasting?
- How could data-backed A/B testing help boost performance or results?
- Are there processes relying on manual effort that could be streamlined?
- Which strategic decisions currently lack objective, fact-based input?
Predictive analytics via BA can also offer forward-looking insights by leveraging complex statistical modeling and data simulations to analyze patterns and forecast future trends, thereby providing businesses with a competitive edge.
Specifically, BA can play a pivotal role in identifying customer behaviors hitherto undiscovered that may present new revenue streams. Production and fulfillment processes plagued by inefficiencies could also be improved by leveraging BI to benchmark performance and diagnose bottlenecks requiring optimization
Strategic divisions whose results dominate the broader business outcomes may immensely gain from predictive forecasting powered by BA to proactively devise plans resilient to uncertainties. Furthermore, automated BA-driven A/B testing can help boost performance by gleaning fact-based learnings from controlled experiments comparing variant scenarios. Rote manual processes prone to errors may also be streamlined by developing dashboards and reports with self-service BI tools.
Key stakeholders who will leverage the BI and BA outputs must be involved early to ensure that proposed solutions adequately cater to their specific needs. The roles that will tap into real-time operational data via BI as well as predictive and prescriptive insights from BA must be determined. This will entail identifying metrics, KPIs, and processes each function needs to monitor or optimize in order to effectively perform their duties.
Lastly, evaluating existing data infrastructure unveils current limitations and opportunities for consolidation. Data silos impeding insights must be integrated while outdated legacy systems necessitating replacement should be identified. Only with a holistic assessment of user needs and technological capabilities can the right BI and BA platforms, tools, and solutions be selected to successfully transform an organization into an intelligence-driven enterprise.
This groundwork leads to a prioritized BI/BA plan, starting with quick wins accessible using native tools and basic skills before scaling up technically or budget-wise. Iterative deployment keeps optimizing value.
Integrating Business Intelligence and Business Analytics for Enhanced Outcomes
Rather than viewing BI and BA as separate initiatives, an integrated fabric powers truly data-driven businesses. Microsoft Power BI exemplifies this unified approach.
Power BI combines self-service business analytics and robust data modeling capabilities. It brings together disparate sources into a single platform for interactive exploration and visual storytelling.
Power BI’s AI capabilities like Q&A and Anthropic augment natural language queries, while pre-built content packs facilitate accelerated insights across industry domains or business functions.
Additionally, the Power BI REST API and software developer kit enable deep customizations. Teams can build BI/BA solutions leveraging their existing skills and Azure infrastructure investments.
Meanwhile, hybrid connectivity with on-prem and multi-cloud environments through Power BI Gateway delivers enterprise-grade flexibility and governance. Role-based security further ensures controlled data access.
Power BI also offers pre-packaged connectors and templates for popular ERP systems and applications, together with out-of-the-box analytics solutions like Power BI for Dynamics 365 and Dynamics 365 Sales Insights.
These capabilities allow fusing historical reporting, and live operational dashboards with predictive and prescriptive layering – delivering a 360-degree view encompassing past, present, and future business facets on a unified foundation.
What’s Next: Embarking on Your Data-Driven Analytics Journey
With digital disruption constantly raising the stakes, analysis-empowered businesses clearly outpace peers. While the concepts underlying BI and BA certainly overlap, a nuanced understanding of their unique strengths is key.
Starting small and focusing on quick wins through iterative prioritization helps build momentum for progressively larger transformations. Consider hiring skilled data science and machine learning experts to maximize BA’s true potential.
At the same time, democratizing insights via user-friendly BI and self-service BA dashboards bridges gaps between frontline staff and top-level strategists.
CCS Learning Academy’s industry-leading data analytics bootcamp program can assist at every step – from assessing your current state and crafting an optimal roadmap to implementing solutions that instill a comprehensive data culture.
We offer tailored coaching, workshops, and hands-on enablement programs to help students while cultivating internal expertise. So don’t delay kickstarting the immense business value unlocked through a fusion of BI and BA. Contact CCS Learning Academy today!